Traffic to Views
The Traffic to Views view gives you the ability to see how much of your user traffic goes to views.
You can filter what information is displayed and the time frame it comes from by selecting the view, the workbook, and the time range.
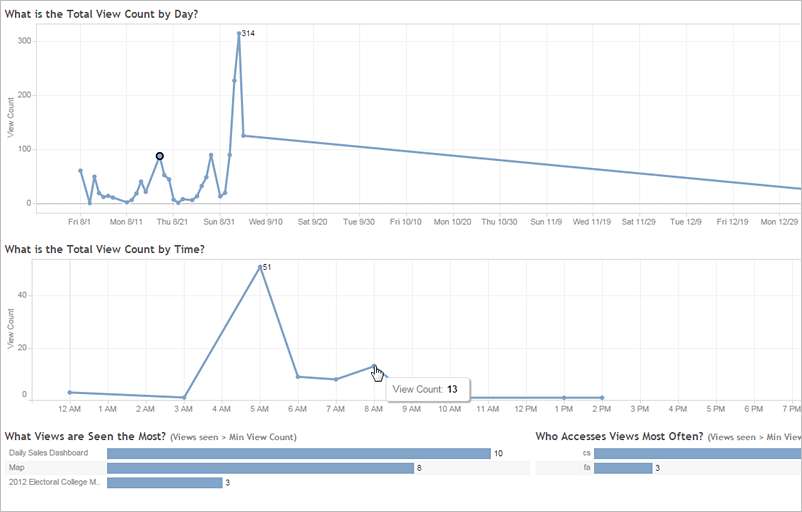
Two time lines at the top of the view show you how views are being used over a time range you specify (the default is the last 7 days):
- What is the Total View Count by Day—This shows total view count by day, based on the filters you set. Hover your mouse pointer over a point on the line to see the count of views. Select the point to update the other sections of the view based on your selection.
- What is the Total View Count by Time—This shows the view count by time of day. The filters and any selection impact this graph.
Two bar graphs at the bottom of the view show results that are filtered by the Min View Count filter at the top of the view. These show you the views that are most often accessed, and the users who most frequently access views Only those views and users with counts greater than or equal to the minimum view count value are displayed:
- What Views are Seen the Most—This is a list of the most visited views. Like the other sections of the view, the information is limited by filters and any selection you make.
- Who Accesses Views Most Often—This shows the users who most often access the views and is limited by filters and any selection you make.