Dashboard-based Custom Portals
Note: This overview was inspired by the work of Tableau Visionary Mark Jackson. For more details about the process, check out Mark's blog.
The standard Tableau Cloud or Tableau Server interface works great for many organizations, but if you want to create a company-branded experience and don't have API developer skills, consider creating a custom portal based on a Tableau dashboard. A custom portal lets you organize content around specific departments or job roles, and you can even incorporate training that helps people interact with data more fully. As the volume of Tableau content grows, a custom portal guides your users directly to the data they need, while providing ready access to related views and Tableau Server search so they can easily explore further.
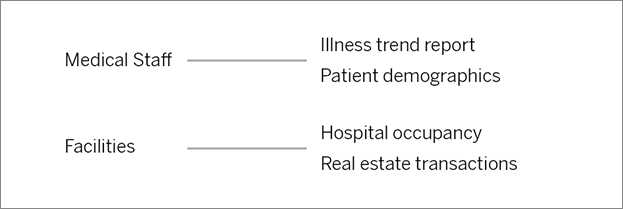
Sketch out a portal design
Begin outside of Tableau, on paper or in a wireframing application. Consider the structure of your organization and the number of Tableau views that apply to each group of users. Do you simply need one level of navigation that points immediately to content? Or might you need to start with a main page that provides navigational links for separate groups of users or report types, followed by a second level with related dashboards and views?
After you get buy-in on your design from key stakeholders and data consumers, you're ready to move on to the next phase.
Gather images for logos and navigation elements
Start thinking about images while refining your initial mockup, and then gather them from libraries of clip-art or approved brand graphics, or create them from scratch in an application like Photoshop or SnagIt. PowerPoint can also be a good source if you plan to create navigation thumbnails of common chart types.
![]()
Lay out text, images, and selected sheets on a dashboard
Create a workbook with a dashboard for the portal, using a tiled layout for more predictable positioning and scaling of elements on different devices. Then start adding Text and Image objects, as well as any sheets for data views you want to highlight right up front in your portal. To refine spacing between these dashboard elements, insert Blank objects and adjust their size. For more information, see Create a Dashboard.
Tip: For dynamic elements that show popular or recently created content, include sheets based on custom administrative views.
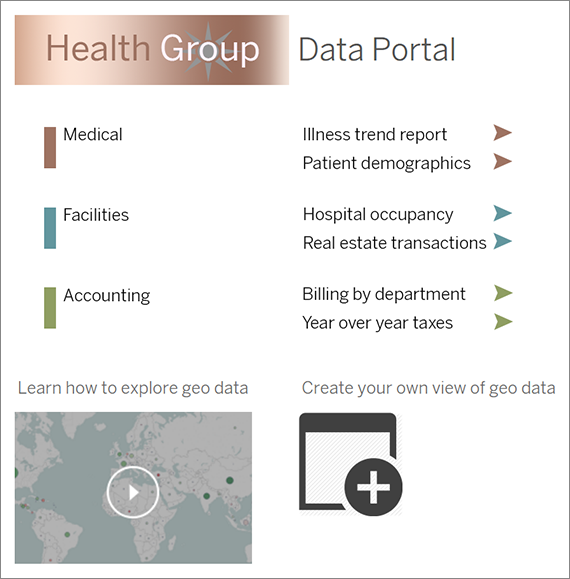
Link dashboard elements to content
If you have a second level of navigation in your portal, use filter actions to point to a secondary dashboard from the main one. To create links that directly open data views, right-click Image objects and choose Set URL. (In our example below, each colored arrow and accompanying text is an image that links to a view URL.) You can even point to empty views with preloaded data sources, encouraging users to create new Tableau content in the web-authoring workspace.
Tip: To add hyperlinks to text objects, include the full URL (for example, http://www.tableau.com).
Publish, test, and refine your portal
Publish the workbook to your server and distribute the dashboard URL to your users. Portal design, like data analysis itself, is a cyclical process. Now that your portal is out in the wild, start gathering user feedback so you can continuously improve the experience
Tip: As a finishing touch, hide the Tableau toolbar to give your portal a custom feel. After the question mark at the end of the dashboard URL, add :embed=y&:toolbar=n