Step 8: Share your findings
You've done a bunch of work—great work—to learn that Burlington, North Carolina needs some fine tuning. Let's share this information with your teammates.
Before you continue, select an option below:
-
If you or your company does not use Tableau Server, or if you want to learn about a free, alternative sharing option, jump to Use Tableau Public.
-
If you or your company uses Tableau Server, and you are familiar with what permissions are assigned to you, jump to Use Tableau Server.
Use Tableau Public
Your story was a hit. You're going to publish it to Tableau Public so that your team can view it online.
Note: When you publish to Tableau Public, as the name suggests, these views are publicly accessible. This means that you share your views as well as your underlying data with anyone with access to the internet. When sharing confidential information, consider Tableau Server(Link opens in a new window) or Tableau Cloud(Link opens in a new window).
-
Select Server > Tableau Public > Save to Tableau Public.
-
Enter your Tableau Public credentials in the dialog box.
If you don't have a Tableau Public profile, click Create one now for free and follow the prompts.
-
If you see this dialog box, open the Data Source page. Then in the top-right corner, change the Connection type from Live to Extract.
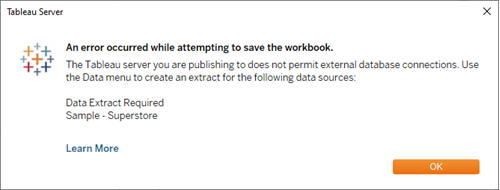 Learn more: Why did you have to create an extract? And what's an extract, anyway?
Tableau Public does not support live data connections, which is why you must create a data extract before publishing.
Data extracts are saved subsets of a data source that you can use to share a snapshot of the data in the workbook, improve performance, or take advantage of Tableau functionality that is not available in the underlying data.
More on working with extracts in the Learning Library (in the top menu).
-
For the second (and last) time, select Server > Tableau Public > Save to Tableau Public.
-
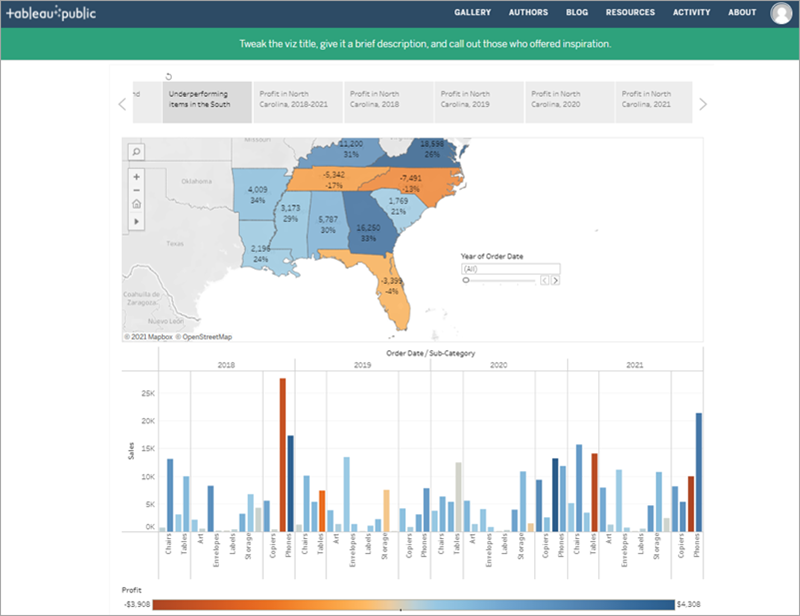
When your browser opens, review your embedded story. It will look like this:
-
Click Edit Details to update the title of your viz, add a description, and more.
-
Click Save.
Your story is now live on the web.
-
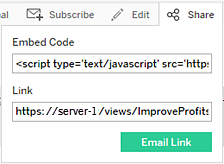
To share with colleagues, click Share at the bottom of your viz.
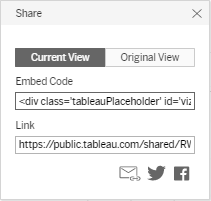
- How do you want to share your story?
Embed on your website: Copy the Embed Code and paste it in your web page HTML.
Send a link: Copy the Link and send the link to your colleagues.
Send an email using your default email client by clicking the email icon.
Share on Twitter or Facebook by clicking the appropriate icon.
After you've completed these steps, click here to jump to the final section of the tutorial.
Use Tableau Server
Your story was a hit. You're going to publish it to Tableau Server so that your team can view it online.
Publish to Tableau Server
-
Select Server > Publish Workbook or click Share
 on the toolbar.
 -
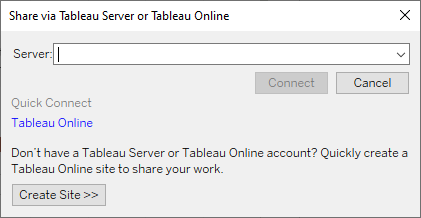
Enter the name of the server (or IP address) that you want to connect to in the dialog box and click Connect.
-
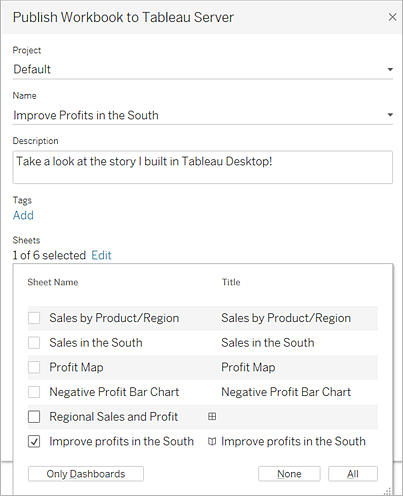
In the Name field, enter Improve Profits in the South.
-
If you want, enter a description for reference, for example "Take a look at the story I built in Tableau Desktop!"
-
Under Sheets, click Edit, and then clear all sheets except Improve Profits in the South.
Learn more: Share more than just your story.If you want, you can share every sheet in your workbook with colleagues on Tableau Server. However, you may want to think about which sheets you'd like to make available to which colleagues.
Note: Depending on your administrator, your permissions may vary.
More on Tableau Server permissions in the Learning Library (in the top menu).
-
Click Publish.
Tableau Server opens in your internet browser. If prompted, enter your server credentials.
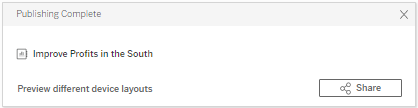
The Publishing Complete dialog box lets you know that your story is ready to view.
Great work! You've successfully published your story using Tableau Server.
Send a link to your work
Let's share your work with your teammates so that they can interact with your story online.
-
In Tableau Server, navigate to the Improve Profits in the South story that you published. You will see a screen like this:
If you had published additional sheets from your workbook, they would be listed alongside Improve Profits in the South.
-
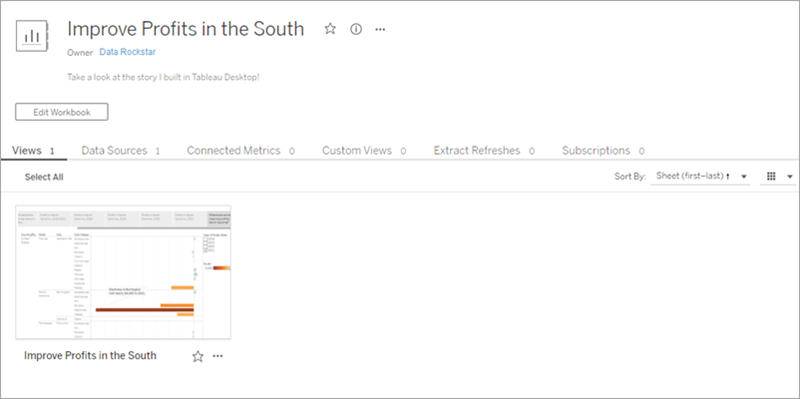
Click Improve Profits in the South.
Your screen will update to look like this:
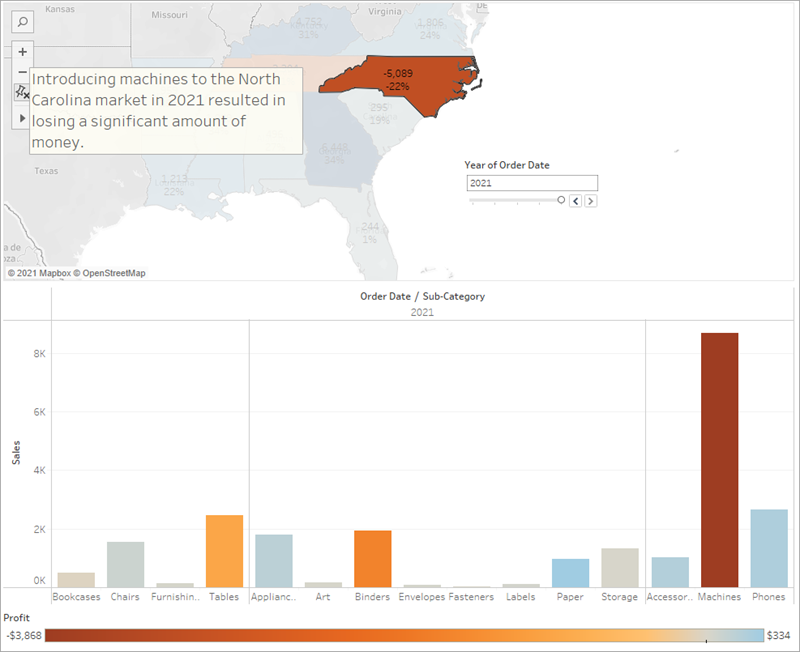
Awesome! This is your interactive, embedded story.
-
From the menu, select Share.
- How do you want to share your story?
Embed on your website by copying the Embed Code and pasting it in your web page HTML.
Send a link by copying the Link and sending the link to your colleagues.
Send an email by using your default email client: Click the email icon.
Congratulations, you did it!
You used Tableau Desktop to create a view of your product data, map the product sales and profitability by region, build a dashboard around your findings, tell a story to present, and share your findings on the web so that remote team members can take a look.
You're a data rockstar.
Well done! You successfully practiced the Tableau "Data Discovery" method:
-
Ask a question
-
Gather data
-
Structure the data
-
Explore the data
-
Share insights
That's the basic workflow you'll follow when you work in Tableau, although you might find yourself doing a lot more revising in each stage than you did here. For example, it might take a few revisions to refine your initial question from something general (what's going on with sales?) to something specific (which city in the South is responsible for negative profit?).
And your revisions might take you in unexpected directions. That’s great, and that's what we hope will happen—we hope that you'll discover opportunities you didn't know existed when you first looked at your data.
If you're ready to jump in and start working with your data, then go forth and explore your data in Tableau! But if you want more information first, check out the Learning Library.