Create Maps that Show Paths Between Origins and Destinations in Tableau
You can create maps in Tableau Desktop that show paths between origins and destinations. These types of maps are called spider maps, or origin-destination maps.
Spider maps are great for when you’re working with hubs that connect to many surrounding points. They are an excellent way to show the path between an origin and one or more destination locations.
There are several ways to create spider maps in Tableau. This topic illustrates how to create a spider map using two examples. Follow the examples in this topic to learn how to set up your data source and build the view for two different spider maps.
For other examples that might fit closer to your data, see the following workbooks on Tableau Public:
Puget Sound Radio Tower Bandwidth(Link opens in a new window)
Recruitment Strategies in the English Premier League(Link opens in a new window)
2014 U.S. Flight Departure Delays(Link opens in a new window)
Note: In the following examples, the data source has points that each have a unique path ID and are each on a different row. If your origin and destination data are on the same row, you can use the MAKELINE function to generate a line mark between two spatial points. See Create a visualisation using MAKELINE.
Example 1: Metro station traffic in Paris, France
Set up your data source
To create this type of spider map in Tableau, your data source should include the following information:
- A path ID for every unique path. See The Line Group (Path ID) column below for more information.
- Numbers to define the drawing order of each data point (location). See The Order of Points column below for more information.
- Latitude and longitude coordinates for every location. See the example table below.
- A column with your location names (recommended, but not required).
The following table is a snippet of the Transports data source, which is included in the Create Spider Maps in Tableau Example 1 Workbook(Link opens in a new window) on Tableau Public. It contains metro traffic data for all metro lines in Paris, France. The first three metro stations for two metro lines are included in this example, and it contains the required columns Line Group (Path ID), Order of Points, Latitude and Longitude. It also contains the additional columns Line, Station and Traffic for added clarity and organisation, but they're not required to build the map view.
| Line | Line Group (Path ID) | Order of Points | Station | Latitude | Longitude | Traffic |
| 1 | 1 | 1 | La Défense (Grande Arche) | 48.891934 | 2.237883 | 14,275,382 |
| 1 | 1 | 2 | Esplanade de la Défense | 48.887843 | 2.250442 | 9,843,051 |
| 1 | 1 | 3 | Pont de Neuilly | 48.884509 | 2.259892 | 6,902,931 |
| 10 BOUCLE | 10 | 1 | Boulogne-Jean-Jaurès | 48.842222 | 2.238836 | 3,847,782 |
| 10 BOUCLE | 10 | 2 | Porte d'Auteuil | 48.848074 | 2.258648 | 687,237 |
| 10 BOUCLE | 10 | 3 | Michel-Ange-Auteuil | 48.847740 | 2.264297 | 2,222,709 |
The Line Group (Path ID) column
For each path, there is a unique key or string, which is added to every location in that path.
In this example, the Line Group (Path ID) column is used to identify each unique path. You will use this column to create your spider map.
For example, in the table above, there are two metro lines (1 and 10 Boucle), and each of those metro lines have a unique path ID listed in the Line Group (Path ID) column. For metro line 1, the Line Group is 1. For metro line 10 Boucle, the Line Group is 10. Every location in line one contains the line group 1, and every location in line 10 Boucle contains the line group 10.
This column defines the point order and the direction in which the line is drawn from the first data point to the last data point on your map, which, in this example is the start and end of the metro line. This field is very important if you have more than two locations in a path, because it draws your paths in the desired order (you can think of it like connecting the dots).
In the example table above, there are three stations on line 1. They are listed in order from La Défense (Grande Arche) to Pont de Neuilly using the numbers 1 through 3 in the Order of Points column. The same is true for line 10 Boucle.
Basic map building blocks:
| Columns shelf: | Longitude (continuous measure, longitude geographic role assigned) |
| Rows shelf: | Latitude (continuous measure, latitude geographic role assigned) |
| Detail: | Path ID field (discrete dimension) |
| Path: | Order field (continuous dimension) |
| Mark type: | Line |
Build the map view
To follow along with this example, download the Create Spider Maps in Tableau Example 1 Workbook(Link opens in a new window) from Tableau Public, and open it in Tableau Desktop.
In the Create Spider Maps in Tableau Example Workbook, click the New Worksheet icon.
In the new worksheet, from Measures, drag Longitude to the Columns shelf, and Latitude to the Rows shelf.
From the Data pane, drag Line Group (Path ID) to Detail on the Marks card.
On the Marks card, click the Mark Type drop-down and select Line.
The map view updates with a line connecting all of the points. The Path button should appear on the Marks card.
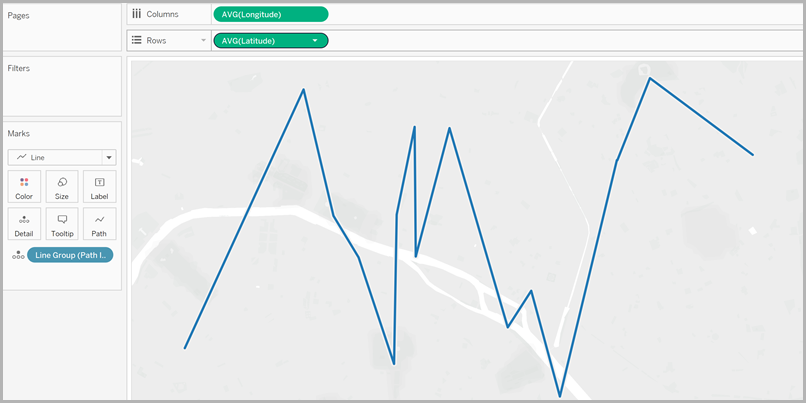
From the Data pane, drag Point Order to Path on the Marks card.
Point Order is aggregated as a sum.
On the Marks card, right-click the SUM(Point Order) field and select Dimension.
The map view updates with a line for every metro line.

From the Data pane, drag Line Group (Path ID) to Colour on the Marks card.
Each line now has its own colour associated with it, and a colour legend is added to the view.
From the Data pane, drag Longitude to the Columns shelf and place it to the right of the first Longitude field.
There are now two Longitude fields on the columns shelf. The view updates with two identical maps. The Marks card updates with two tabs: one for the map on the left, and one for the map on the right. You can customise each of these tabs to change the visual detail of each map view. There is an All tab to control the visual detail in both maps at the same time.
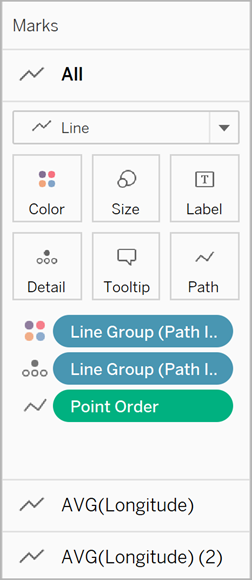
On the Marks card, click the bottom AVG (Longitude) (2) tab.
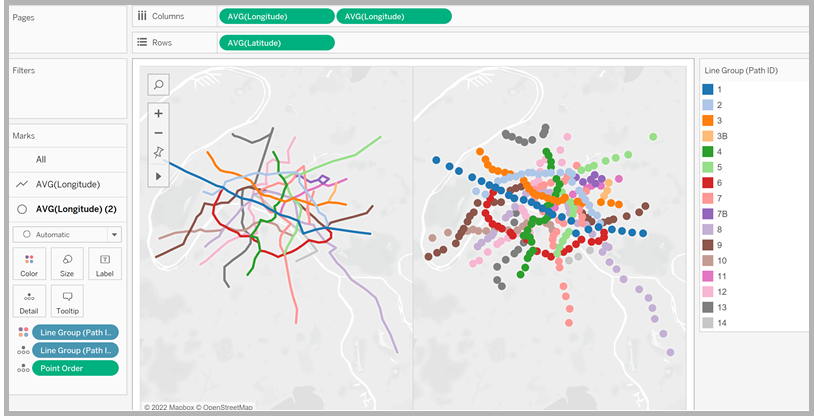
On the Marks card, under the bottom AVG (Longitude) tab, click the Mark type drop-down and select Automatic.
The map view on the right updates to a point map.
On the Columns shelf, right-click the second AVG (Longitude) field (on the right), and select Dual Axis.
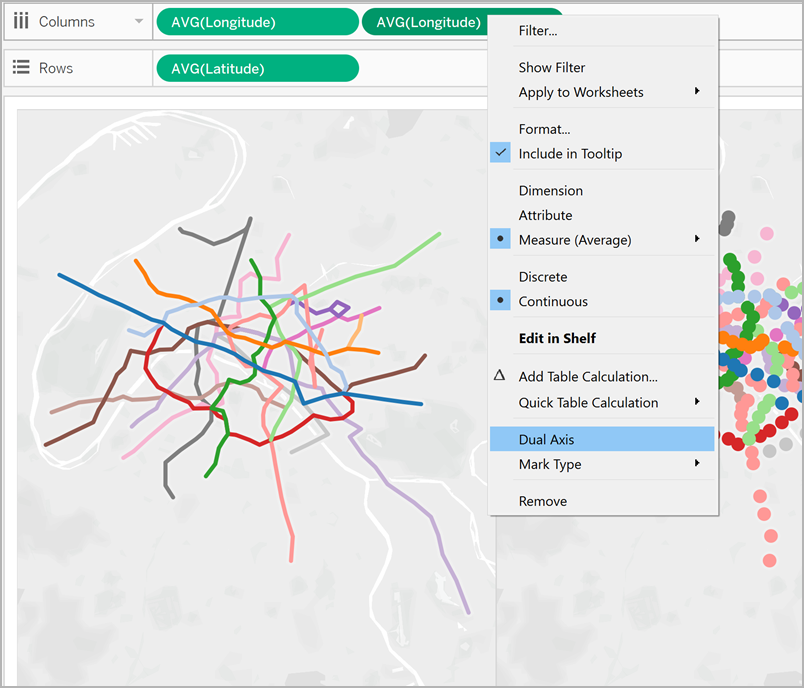
Your map views are now layered on top of one another.
From the Data pane, drag Traffic to Size on the bottom AVG (Longitude) Marks card.
The size of the data points update to show the amount of traffic per station.
On the Marks card, click Size and move the slider to the right.
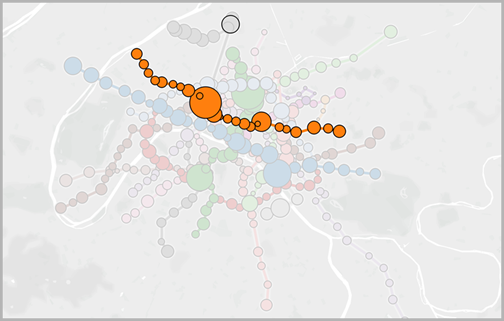
On the Marks card, click Colour, and then, under Effects, click the Border drop-down and select a colour.
The view is now complete. You can quickly find the stations on each metro line with the most traffic.
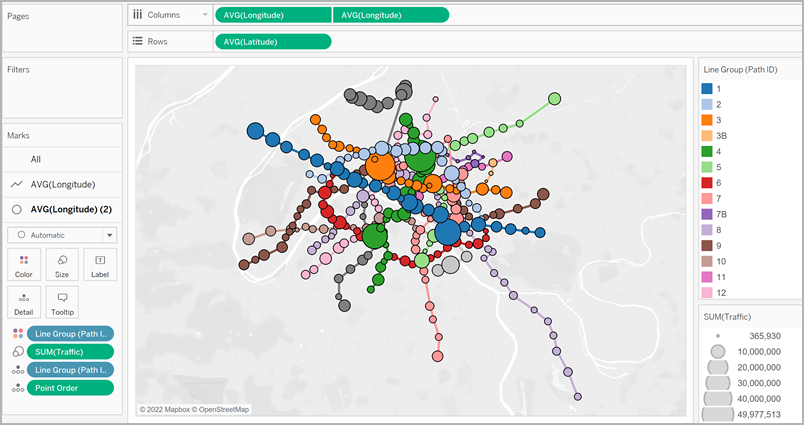
Filter the amount of information in the view
If you want to filter the amount of lines you see in the view:
From the Data pane, drag Line Group to the Filters shelf.
You can also right-click the Line Group field and select Show Filter to show a filter card in the view.
Example 2: Bike share data in Seattle, Washington
Set up your data source
Similar to the first example, for this type of spider map, your data source should contain the following information:
- A Path ID for every unique path. See The Path ID column below for more information.
- Latitude and longitude coordinates for every location. See the example table below.
- Two rows in your data source for each path. You should have one row for your origin location data and one row for your destination location data, repeated for every path. This is a crucial step that enables Tableau to draw your paths correctly. See Origin-destination rows below for more information.
- A column with your location names (recommended, but not required).
This example is a snippet of the Seattle bike share data source, which is included in the Create Spider Maps in Tableau Example 2 Workbook(Link opens in a new window). It has a column for Origin-Destination, Station, Path ID, Latitude and Longitude. Only the last three columns in this data source are required to create a spider map, but the Origin-Destination and Location Name columns provide further clarity and organisation.
| Origin-Destination | Station | Path ID | Latitude | Longitude |
| Origin | BT-01 | BT-01_BT-01 | 47.61841 | -122.35101 |
| Destination | BT-01 | BT-01_BT-01 | 47.61841 | -122.35101 |
| Origin | BT-01 | BT-01_BT-03 | 47.61841 | -122.35101 |
| Destination | BT-03 | BT-01_BT-03 | 47.61576 | -122.34843 |
| Origin | BT-01 | BT-01_BT-04 | 47.61841 | -122.35101 |
| Destination | BT-04 | BT-01_BT-04 | 47.61613 | -122.34108 |
| Origin | BT-01 | BT-01_BT-05 | 47.61841 | -122.35101 |
| Destination | BT-05 | BT-01_BT-05 | 47.61303 | -122.34410 |
For each unique path you want to create, you need a row for your origin location, and a row for you destination location in your data source. This means your origin location will be paired with every destination location.
For example, when showing the path between an origin bike share location and several destination locations in a city, you need a row for the origin location, and a row for the destination location for every single path.
In the example above, the origin station BT-01 is paired with several different destination locations (BT-01, BT-03, BT-04, BT-05) to show that bikes were checked out of the BT-01 location and returned either to the same location or to a different location. Each origin-destination pair is colour-coded to show that they make up one path. There is a column for Origin-Destination to further illustrate this concept, but this column is not required.
The Path ID column is used to identify each unique origin-to-destination path. You will use this column to create your spider map.
For each origin and destination location, there is a unique key or string that identifies them as a pair.
In the example below, for the first origin-destination path, the Path ID is BT-01_BT-01. For the second origin-destination path, the Path ID is BT-01_BT-03. Each path ID is listed twice, once for the origin location, and once for the destination location. Again, each pair is colour-coded to indicate that they make up one path.
| Origin-Destination | Location Name | Path ID | Latitude | Longitude |
| Origin | BT-01 | BT-01_BT-01 | 47.61841 | -122.35101 |
| Destination | BT-01 | BT-01_BT-01 | 47.61841 | -122.35101 |
| Origin | BT-01 | BT-01_BT-03 | 47.61841 | -122.35101 |
| Destination | BT-03 | BT-01_BT-03 | 47.61576 | -122.34843 |
Note: Your path ID can be anything you want. However, if you want to create complex calculated fields to help filter the locations later on, it helps if your path IDs are consistent across all paths. A great way to do this is to create Path IDs that are a combination of your origin and destination location names, separated by a delimiter. For example, the Path ID for the origin location BT-01 and the destination location BT-03 is BT-01_BT-03. For an example of why you might want to do this, see the Option 2: Create a dynamic filter: section.
Basic map building blocks:
| Columns shelf: | Longitude (continuous dimension, longitude geographic role assigned) |
| Rows shelf: | Latitude (continuous dimension, latitude geographic role assigned) |
| Detail: | Path ID field (discrete dimension) |
| Mark type: | Line |
Build the map view
After you set up your data source, you can connect to it in Tableau Desktop and build a spider map. To follow along with this example, download the Create Spider Maps in Tableau Example 2 Workbook(Link opens in a new window) from Tableau Public.
From the Data pane, drag Longitude to the Columns shelf and Latitude to the Rows shelf.
On the Columns shelf, right-click the Longitude field and select Dimension. Do the same for the Latitude field on the Rows shelf.
This will ensure Tableau does not aggregate your origin and destination locations.
On the Marks card, click the Marks Type drop-down, and select Line. The view updates to show a line connecting each data point, and the Marks card updates with a Path button.
From the Data pane, drag Path ID to Detail on the Marks card.
You should see all the locations in the data source as data points on your map. In this example, there is a data point for every bike share location in the data source.
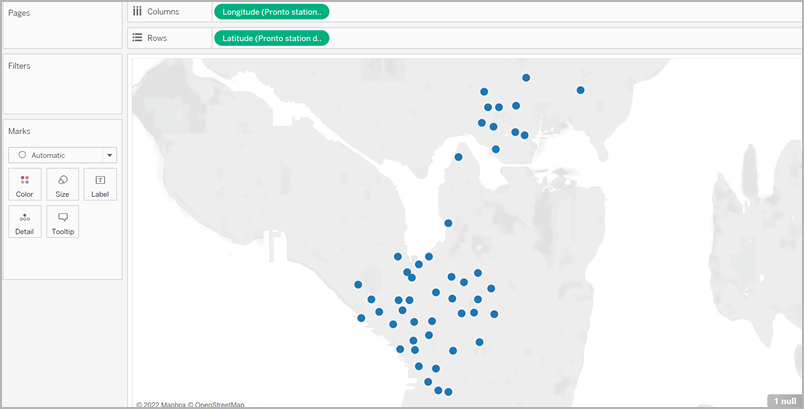
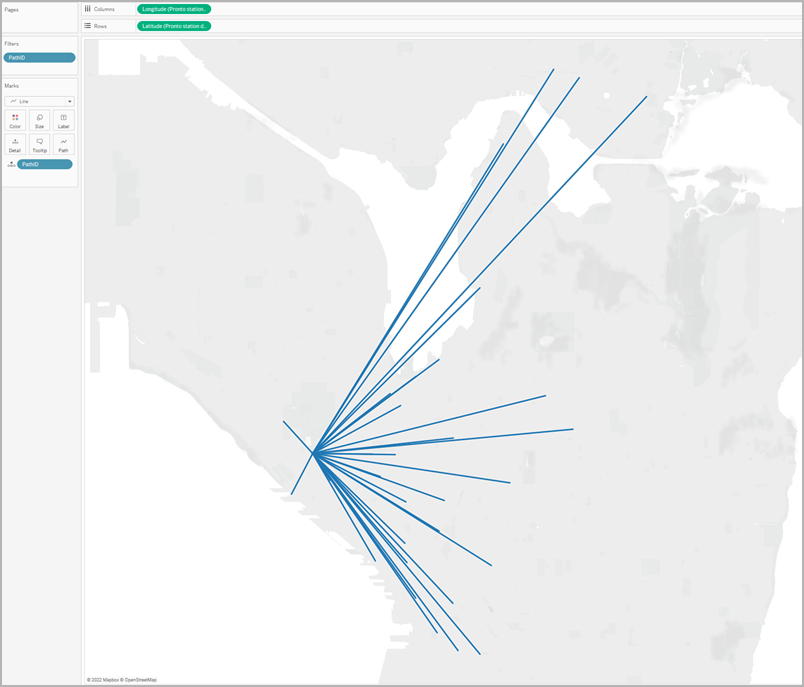
If you have only a few origin-destination pairs, your view might look something like the following:
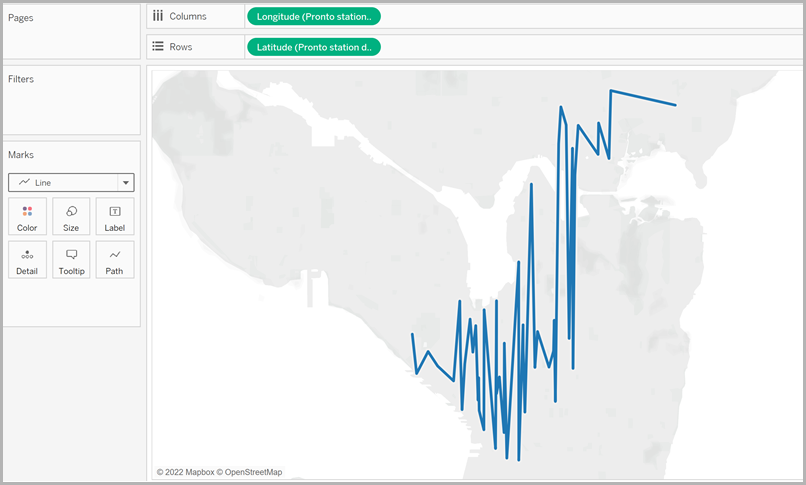
However, if you have many origin-destination pairs, your view might look more like this:
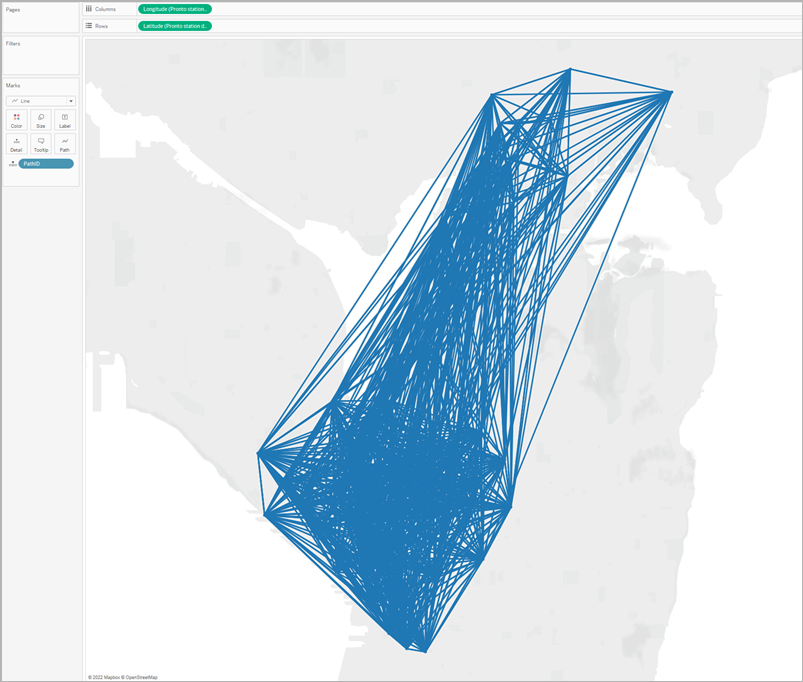
This is very common, and can be fixed by filtering a large portion of your paths from the view. Continue to the following section to learn a couple of ways to do so.
Filter the amount of information in the view
If your data source contains a lot of origin-destination pairs, you can filter most of them from the view.
Option 1: Create a simple filter:
From the Data pane, drag Path ID to the Filters shelf.
In the Filter dialog box that opens, do the following:
Under the General tab, select None.
Click the Wildcard tab.
Under the Wildcard tab, for Match Value, enter BT-01, and then click Starts With.
Click OK.
This filters the view down to only the paths that start with BT-01.
Option 2: Create a dynamic filter:
You can also create a calculated field and combine it with a parameter so you can switch between the paths you want to see right in the view. Follow the steps below to learn how.
Step 1: Create the parameter
On the Data pane, click the Data pane drop-down and select Create Parameter.
In the Create Parameter dialog box, do the following:
Name the parameter StationSelected.
For Data type, select String
For Allowable values, click List, select Add from field, and then select the Location Names field.
Click OK.
Step 2: Create the calculated field
Select Analysis > Create Calculated Field.
In the calculation editor, name the calculated field, Select by Origin-Destination, and then enter the following formula:
IF

 LEFT([Path ID], FIND([Path ID], "_") -1) = [StationSelected] THEN "Origin"

ELSEIF

 RIGHT([Path ID], LEN([Path ID]) - FIND([Path ID], "_")) = [StationSelected] THEN "Destination"

ELSE

 "Unselected stations"
END
In the table above, each Path ID (for example BT-01_BT-03) contains an underscore (_) as a delimiter to separate the origin location name (BT-01) from the destination location name (BT-03). This delimiter is used in the formula to tell Tableau which locations (selected in the parameter you created in step 1 of this procedure) are origin locations, and which are destination locations. The parameter you created above is also used in the formula (StationSelected).
Check that the calculation is valid, and then click OK.
Step 3: Add the calculated field to the Filters shelf
From the Data pane, drag the calculated field to the Filters shelf.
In the Filter dialog box, select Origin, and then click OK.
Step 4: Show the parameter control
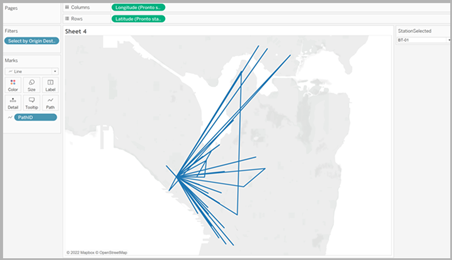
In the Data pane, right-click the parameter you created and select Show Parameter Control.
You can now select an origin from the parameter control in the view, and the marks on your map view will update.
See also:
Tableau Community post: Origin-Destination Maps (or Flow Maps)(Link opens in a new window)
Create Maps that Show a Path Over Time in Tableau(Link opens in a new window)
Mapping Concepts in Tableau(Link opens in a new window)