Parameter Actions
Use parameter actions to let your audience change a parameter value through direct interaction with a viz, such as clicking or selecting a mark. You can use parameter actions with reference lines, calculations, filters, and SQL queries, and to customize how you display data in your visualizations.
Parameter actions open up new possibilities for creating summary values and statistics without using calculations. You can configure parameter actions to let users select multiple marks that are automatically aggregated into a single parameter value. For example, a parameter action could show the AVG(Sales) or COUNTD(Orders) for currently selected marks.
For examples of how parameter actions can be used, see Examples of parameter actions.
You can create parameter actions in Tableau Desktop, Tableau Cloud, and Tableau Server.
When you define a parameter action, it must include:
- the source sheet or sheets it applies to.
- the user behavior that runs the action (hover, select, or menu).
- the target parameter, the source field, and the respective aggregation (if applicable).
The parameter referenced in the action must also be referenced in some part of the visualization. You can do this in different ways, such as referencing the parameter in a calculated field or reference line that is used in the viz. You can also build a view that uses a source field that is referred to in the parameter action.
General steps for creating parameter actions
-
Create one or more parameters. For more information, see Create Parameters.
-
Optional: Depending on the behavior you want to make available to users for their analysis, you might want to create a calculated field that uses the parameter. For details on creating calculated fields, see Create a calculated field.
-
Build a visualization that will make use of parameter actions.
For example, if you created a calculated field that uses the parameter, build the view using that calculated field. Or, drag a field that you plan to tie to the parameter into the view.
-
Create a parameter action that uses a parameter. You can create multiple parameter actions for different purposes. The parameter action must refer to the sheet name of the visualization, the parameter name, and the source field that the parameter will be associated with.
-
Test the parameter action and adjust its settings or other related elements in your visualization as needed to get the behavior you want your audience to experience.
Note: It is helpful to understand how you can use parameters in Tableau before you start using them in parameter actions. For more information:
- Read the Create Parameters help topic and related parameter topics.
- See Use Parameters to Add Multiple Views to Your Viz(Link opens in a new window) on the Tableau blog(Link opens in a new window) and multiple practical topics on how to use parameters on the Data School(Link opens in a new window) website, such as Four Steps to Creating a Parameter(Link opens in a new window).
- For an in-depth presentation, watch Parameters | Oh, the places you'll go!(Link opens in a new window) (45 minutes).
Create a parameter action
-
In a worksheet, select Worksheet >Actions. In a dashboard, select Dashboard >Actions.
-
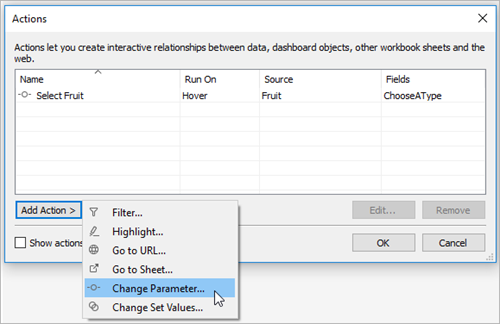
In the Actions dialog box, click Add Action and then select Change Parameter.
-
In the Actions dialog box, specify a meaningful name for the action.
-
Select a source sheet or data source. The current sheet is selected by default. If you select a data source or dashboard you can select individual sheets within it.
-
Select how users will run the action.
-
Hover - Runs when a user hovers the mouse cursor over a mark in the view. Also exposes an option for the action in the mark's tooltip.
-
Select - Runs when a user clicks a mark or selects multiple marks in the view.
-
Menu - Runs when a user right-clicks (macOS: control-clicks) a selected mark in the view, then selects an option on the context menu. Also exposes an option for the action in the mark's tooltip.
-
-
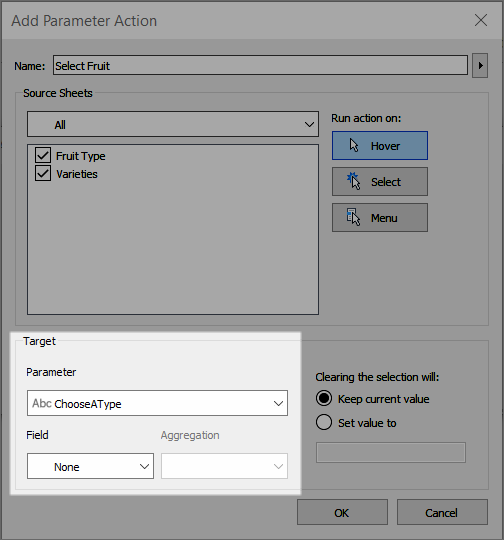
Under Target, specify the target parameter and a source field. All parameters in the workbook are available in the Parameter list.
To let your users select multiple marks that get aggregated into a single parameter value, select an aggregation type.
Note: If you want your users to be able to select multiple marks, you will need to select an aggregation. If Aggregation is set to None, and multiple marks that contain different values for the source field are selected, the parameter action will not run.
The aggregation that you choose for the parameter action can be different than the aggregation used for that field in the view. For example, you could create a view that uses SUM(Sales), but set the Sales source field referenced in the parameter action to use Average for the aggregation. Note that if you then change the aggregation of the Sales field in the view to AVG(Sales), you will need to update the parameter action to reference the Sales field again.
-
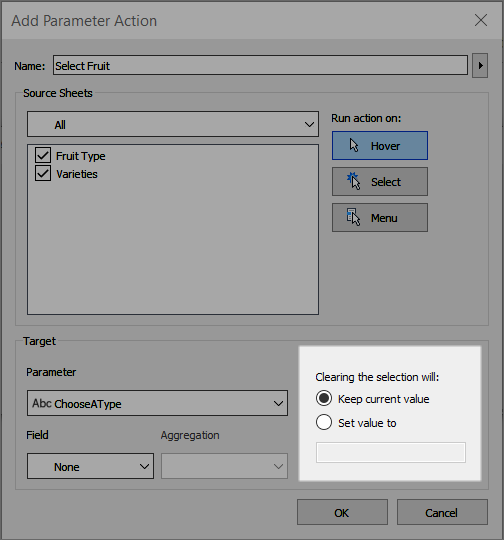
Specify what will happen when the selection is cleared.
-
Keep current value - Current parameter value will remain in the view.
-
Set value to - Parameter value will revert to the indicated value.
-
-
Click OK to save your changes and return to the view.
-
Test the parameter action by interacting with the visualization. Tweak some of the settings for the action to adjust the behavior as needed.
Examples of parameter actions
The following examples demonstrate how you can use parameter actions, but these are just the beginning of what is possible. To follow along, it helps to be familiar with creating and using parameters and calculated fields. For more information, see Create Parameters and Create a calculated field.
For additional examples of how you can use parameter actions, see:
- How and when to use parameter actions(Link opens in a new window)
- Parameter Actions: KPI Navigator(Link opens in a new window)
- Parameter Actions: Year over Year Comparison(Link opens in a new window)
- Parameter Actions: Layered Analysis(Link opens in a new window)
- Parameter Actions: Concatenation(Link opens in a new window)
- 3 Creative Ways To Use Tableau Parameter Actions(Link opens in a new window) from Tableau Visionary Ryan Sleeper on the PlayfairData(Link opens in a new window) website.
- Tableau Parameter Actions Sneak Peek(Link opens in a new window) from Tableau Visionary Joshua Milligan on the VizPainter(Link opens in a new window) website.
Make reference lines dynamic
This example demonstrates how you could use a parameter action to interactively update a reference line, without using a calculation.
Reference lines provide a convenient way to compare values in a visualization. You can then use parameter actions to make reference lines dynamic. You can associate the reference line with a parameter, and then use a parameter action to make the parameter interactive. As your users interact with the view, the reference lines automatically update to provide more context to the data.
The following fields are used in this view.
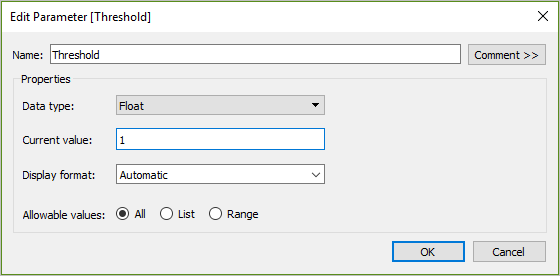
- Create the parameter. The parameter is named Threshold. The data type is set to Float.
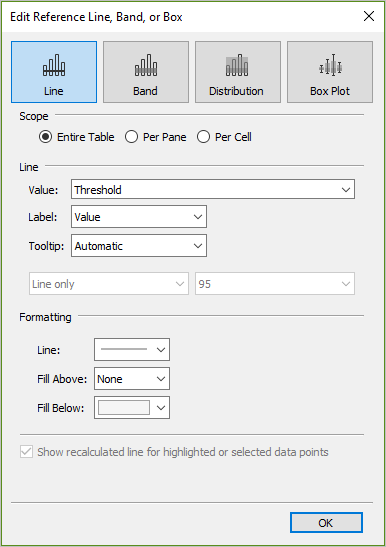
- Create a reference line that uses the Threshold parameter. The label is set to Value. The Fill Below option is set to a light gray color.
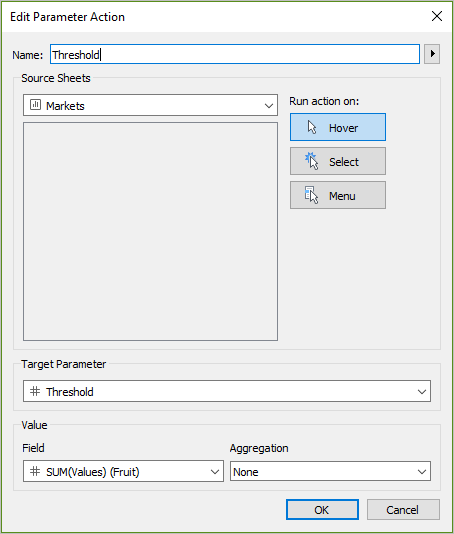
- Create a parameter action. This action references the Threshold parameter and the Values field. The action runs on Hover.
- Test the parameter action in the sheet. Hovering over a mark in the view updates the reference line to see how that value appears in context with the other categories of data.

Display a selective hierarchy
This example demonstrates how you could use a parameter action that is referenced by a calculated field to let your audience control what information is being displayed in a view.
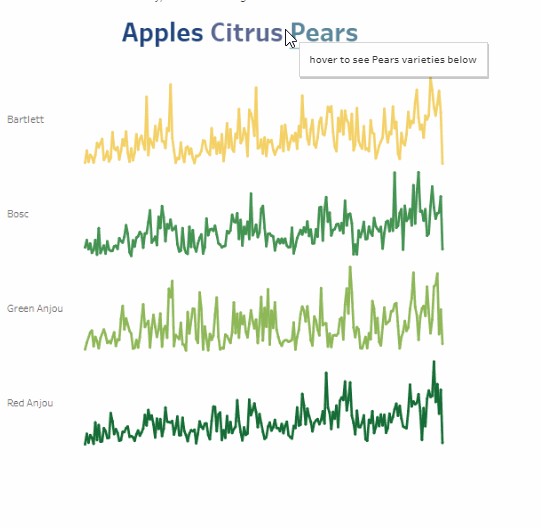
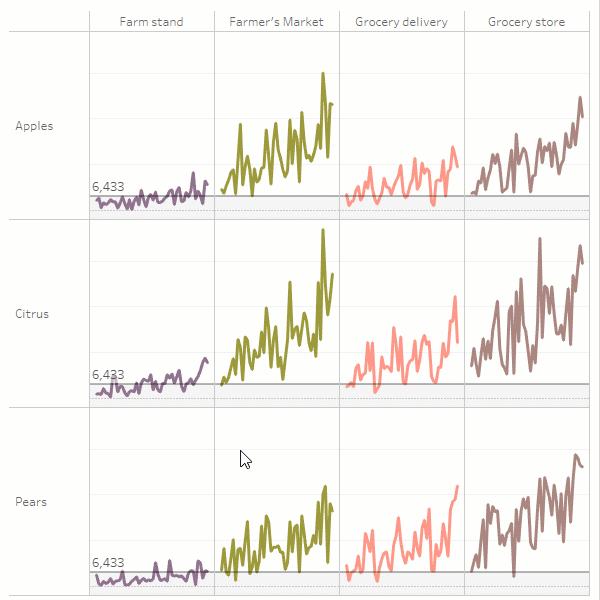
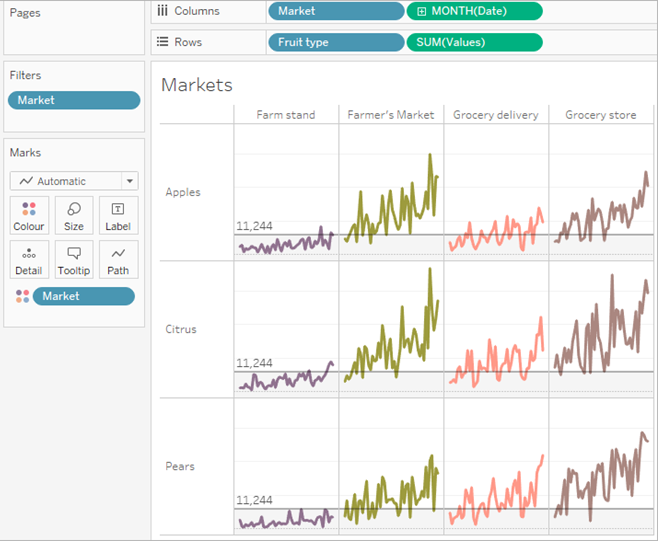
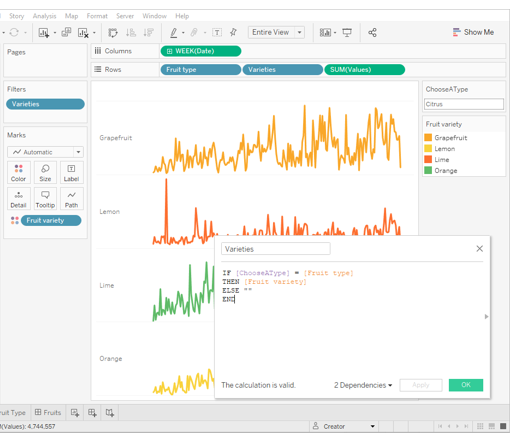
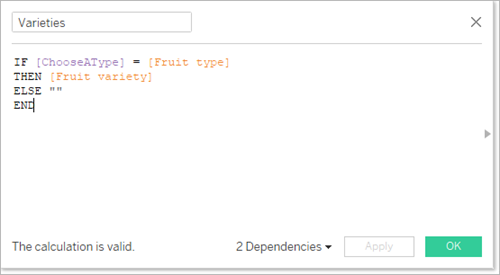
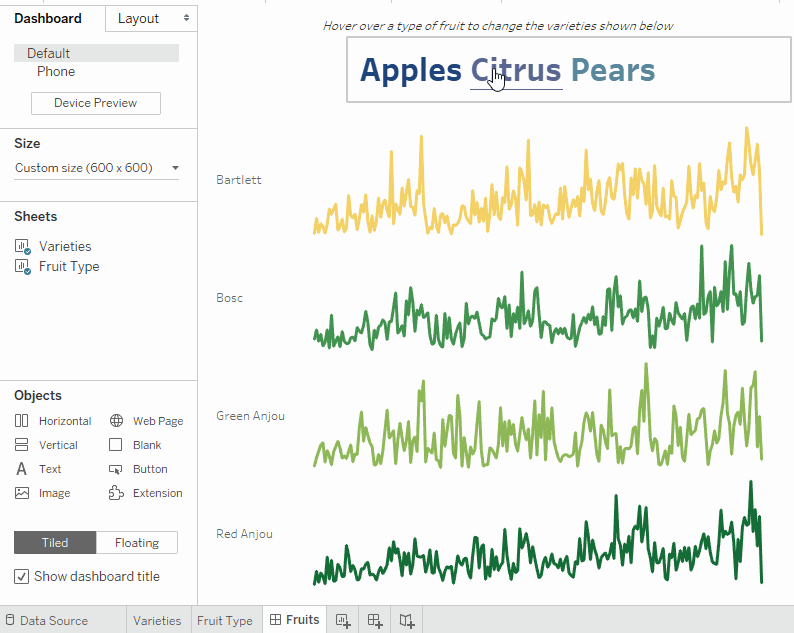
One common use for parameters is using a parameter to change the input value in a calculation. This example uses a parameter ChooseAType for the type of fruit and a calculated field Varieties that returns the varieties for the type of fruit. The calculated field has been added to the view instead of the original field Fruit variety. Users can select a fruit type using a parameter control to change the fruit type and varieties being displayed.
Using a parameter with a calculation and a parameter control to interactively change a parameter value
This is one way to let your users explore the data in the view. Parameter actions make this same scenario possible, but with added functionality and benefits. When you create a parameter action that updates the value of the parameter based on a user interacting with the marks in the view:
- User interaction with the viz is more natural. Your users can stay in the flow of exploring the data. Rather than needing to interact with a parameter control, your users can hover or click in the viz to update the parameter value.
- If the data source is updated at some time in the future, and more fruit type and fruit variety values are added, those values will automatically be displayed in the viz and are automatically available to the parameter.
To incorporate parameter actions, this example makes use of a second sheet (Fruit Type) that consists of the names of the fruit types. The two sheets (Fruit Type and Varieties) are combined into a dashboard (Fruits).
-
The workbook shown in the image above uses the ChooseAType parameter and the Varieties calculated field.
The ChooseAType parameter is set to allow All Values.
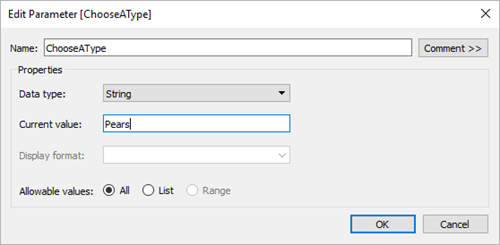
The Varieties calculated field references the ChooseAType parameter to show the values from the Fruit variety field based on the current value selected for Fruit type.
-
The workbook uses a parameter action named Select Fruit. To create the parameter action, the author clicked a sheet, and then selected Worksheet > Actions > Add Action > Change Parameter.
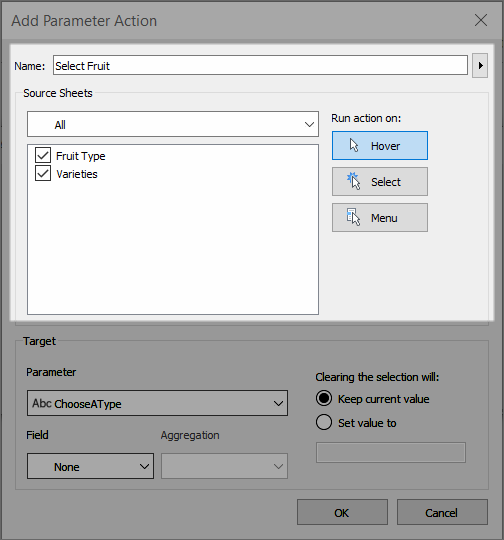
The action uses the Fruit data source. Because the parameter and calculation both need to be aware of the Fruit type field to function, both the Fruit Type and Varieties sheets need to be selected.
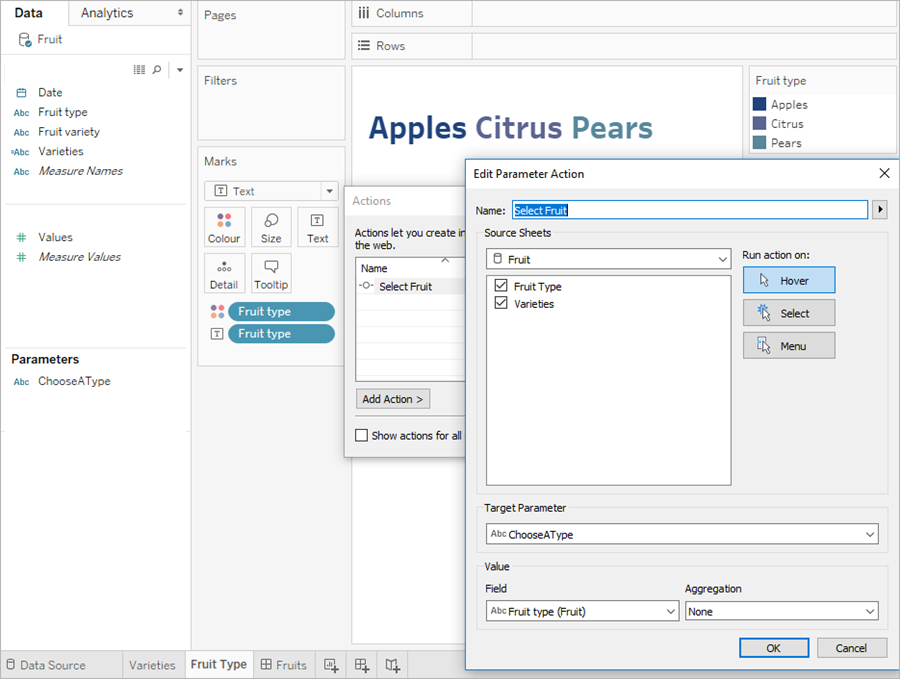
The parameter ChooseAType is associated with the Fruit type field. The parameter action will run whenever a user hovers over the fruit type text in the Fruits dashboard, or in the Fruit Type sheet.
In the Varieties sheet, the Fruit type field is on the Rows shelf, but the Show Header option is unchecked for that field to remove the fruit type label from this view.
-
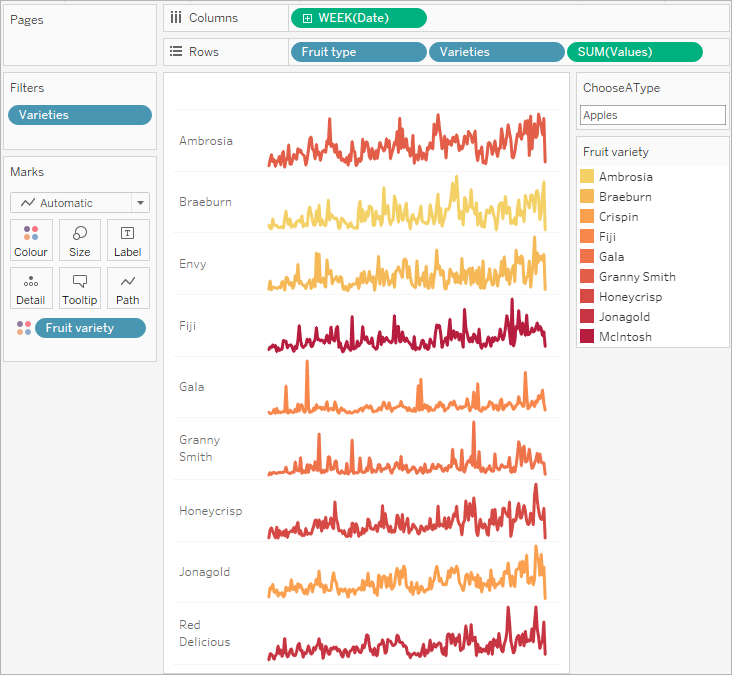
Test the parameter action in the Fruits dashboard. Hovering over the fruit type updates the view to show the varieties of that fruit.
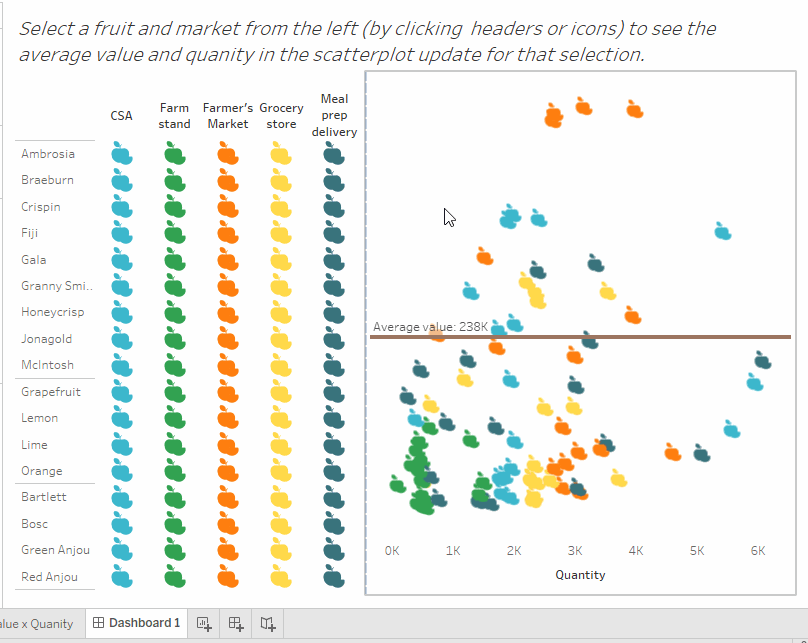
Display summary data for selected marks
Getting summary statistics for a subset of data is a valuable analytical tool. This example shows how you can use aggregated parameter actions for selected marks to automatically generate summary data.
This view of a sheet named Options shows fruit varietals and their intended markets.
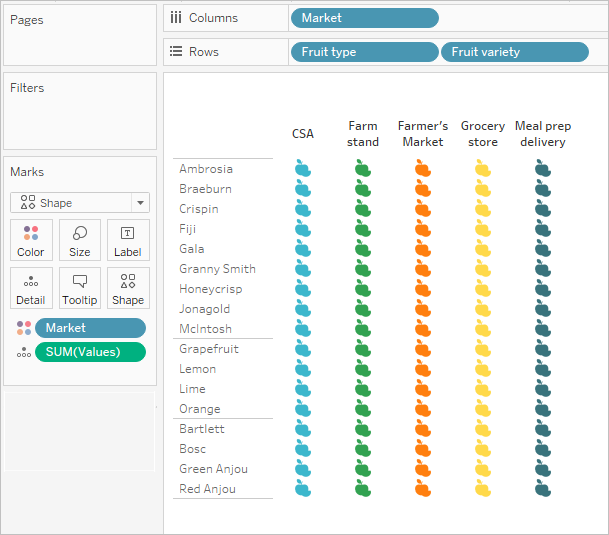
The SUM(Values) field needs to be present on both sheets for the parameter to work. SUM(Values) is placed on Detail in the Marks card in this view.
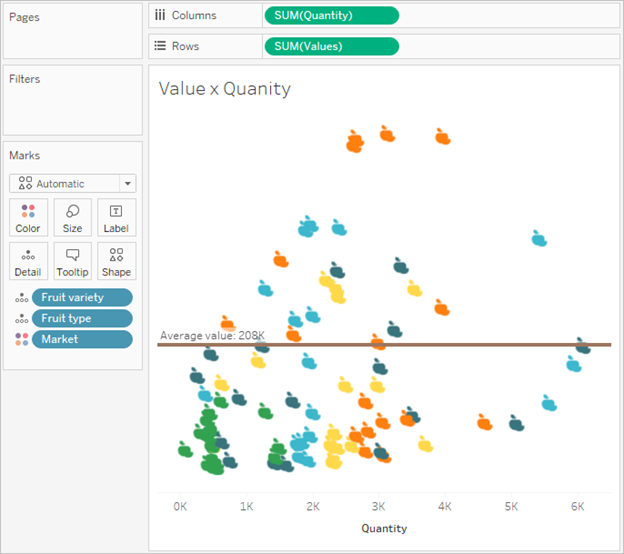
The previous Options view will function as a selector for this second view, a scatter plot that plots the same marks against their total value and quantity. SUM(Values) is placed on Rows in this view.
A parameter action will be used to make the two views work together in a dashboard.
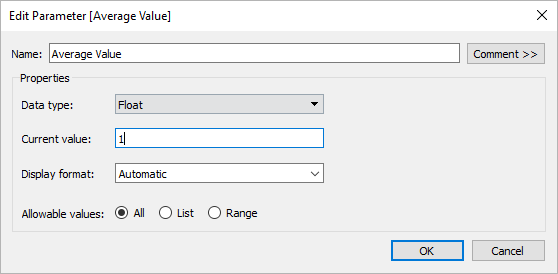
- Create the parameter. This parameter is named Average Value. The data type is set to Float.
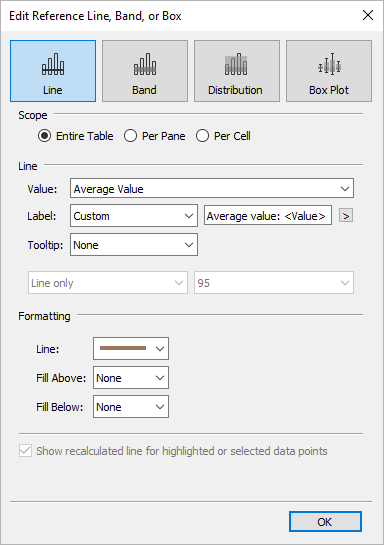
- Create a reference line that uses the Average Value parameter. The label is set to Custom with the text "Average value: <Value>". The Line option is set to a brown color.
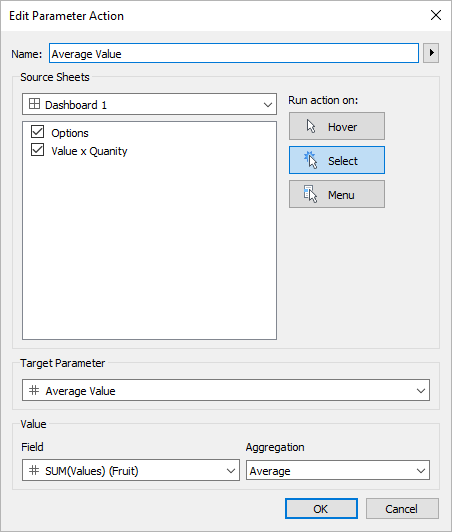
- The two sheets are combined in a dashboard. To create the parameter action, click the dashboard tab, and then select Dashboard > Actions > Add Action > Change Parameter.
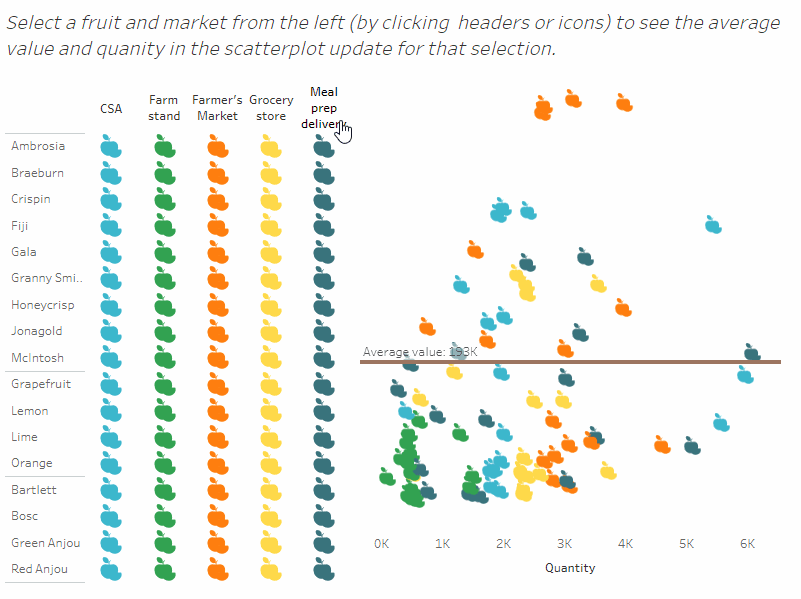
- Test the parameter action in the dashboard. As you select headers and marks, the reference line updates dynamically and displays the average of the values.
The action is named Average Value. The target parameter references the Average Value parameter. The source field is set to SUM(Values) (Fruit).
The setting for aggregation is where the summary statistic information comes into play. By choosing Average, Median, Count, etc., you set the parameter to update with the statistic of your choosing.
The aggregation is set to Average. Also note that the aggregation for the source field in the view can be different from the aggregation that you use for the parameter action.
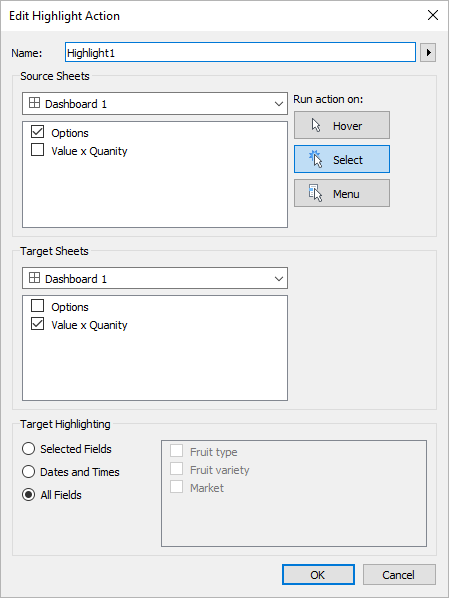
Optionally, you could also create a highlight action for marks selected in the Options view.