Google Analytics
Note:Tableau adheres to Google’s API Services User Data Policy and Limited Use Requirements when using or transferring information from Google APIs to other apps.
This article describes how to connect Tableau to Google Analytics (GA) and set up the data source.
Note:Google Analytics 4 property isn't supported.
Before you begin
Before you begin, gather this connection information:
-
GA email address and password
Recommendation
Setup a custom OAuth Client to use your company's IT policies
You can fully control your OAuth configuration according to your own IT policies with a custom OAuth client. The option to use your own OAuth client frees you from being tied to Tableau release cycles and Tableau’s OAuth client rotation schedule. For information on how to configure your own OAuth client see, Configure custom OAuth for a site.
Make the connection and set up the data source
-
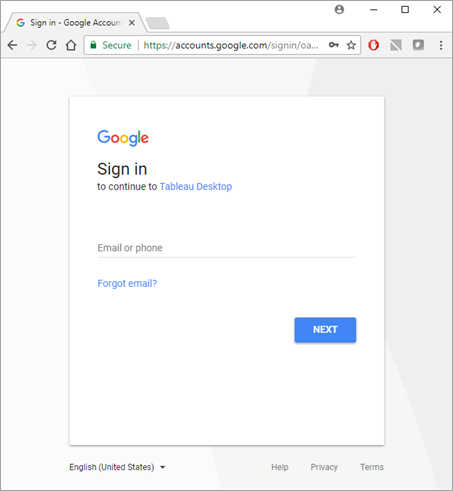
Start Tableau and under Connect, select Google Analytics. For a complete list of data connections, select More under To a Server. In the tab Tableau opens in your default browser, do the following:
-
Sign in to GA using your email or phone, and then select Next to enter your password.
-
Select Allow so that Tableau Desktop can access your GA data.
-
Close the browser window when notified to do so.
-
On the data source page, do the following:
-
(Optional) Select the default data source name at the top of the page, and then enter a unique data source name for use in Tableau. For example, use a data source naming convention that helps other users of the data source figure out which data source to connect to.
-
Follow the steps at the top of the data source page to complete the connection.
-
Step 1 – Select an Account, Property, and Profile using the dropdown menus.
-
Step 2 – Select filters for a date range and a segment.
-
For Date Range, you can select one of the predefined date ranges or select specific dates. When selecting a date range, GA can provide complete data only up to the previous full day. For example, if you choose Last 30 days, data will be retrieved for the last 30-day period ending yesterday.
-
For Segment, select a segment to filter your data. Segments are preset filters that you can set for a GA connection. Default Segments are defined by Google, and Custom Segments are defined by the user on the GA website. Segments also help prevent sampling to occur by filtering the data as defined by the segment. For example, with a segment, you can get results for a specific platform, such as tablets, or for a particular search engine, such as Google.
-
-
Note: GA restricts the amount of data that it returns in a query. When you try to retrieve more data than GA allows in a single query, GA returns sampled data instead. If Tableau detects that your GA query might return sampled data, Tableau attempts to bypass the query restriction to return all data instead. For more information, see All data vs. sampled data returned from a query below.
Step 3 – Add dimensions and measures by using the Add Dimension and Add Measure dropdown menus, or select a predefined set of measures from the Choose a Measure Group dropdown menu. Some dimensions and measures can’t be used together. For more information, see Dimensions & Metrics Reference Guide(Link opens in a new window) on the Google developer website.
-
-
Select the sheet tab to start your analysis. After you select the sheet tab, Tableau imports the data by creating an extract. Tableau Desktop supports only extracts for Google Analytics. You can update the data by refreshing the extract. For more information, see Extract Your Data.
All data vs. sampled data returned from a query
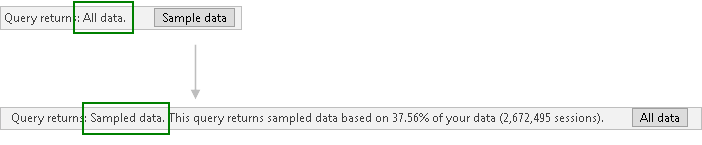
GA restricts the amount of data that it returns from a query and provides sampled data instead. Sampled data is a random subset of your data. When performing analysis on sampled data, you can miss interesting outliers, and aggregations can be inaccurate. If Tableau detects that your query might return sampled data, by default, Tableau creates multiple queries from your query, and then combines the results from the queries to return all data.
You see the following message when Tableau returns all data.

If the query stays within the boundaries of the query restrictions, GA doesn't return sampled data and you don’t see the above message.
Troubleshoot issues with returning all data
If your query continues to return sampled data, consider the following:
-
Missing required context variable - Google Analytics 4 property isn't supported.
-
Missing date dimension – You must use the date dimension in your query to return all data.
-
Too much data – Your query might contain too much data. Reduce the date range. The minimum date range is one day.
-
Non-aggregatable dimensions and measures – Some dimensions and measures can’t be separated into multiple queries. If you suspect a problematic dimension or measure in your query, hover over the All data button to see the tooltip that shows which dimensions or measures to remove from your query.
-
Legacy workbooks – Workbooks created in Tableau Desktop 9.1 and earlier can’t return all data. Open the legacy workbook in Tableau Desktop 9.2 and later and save the workbook.
Return sampled data
In cases when workbook performance is critical or there are specific dimensions and measures you want to use in your query that aren’t supported by Tableau’s default query process, use sampled data instead. To return sampled data, select the Sample data button.
See also
- Set Up Data Sources – Add more data to this data source or prepare your data before you analyze it.
- Build Charts and Analyze Data – Begin your data analysis.
5 Tips to Get More from Google Analytics(Link opens in a new window) - Read the Tableau whitepaper (registration or sign in required).