Creators: Get Started with Web Authoring
There's a lot you can do with Tableau on the web. As a Creator, you can connect to data directly to power your analytics, create stunning data visualizations, and share those insights with others. In this guide, we’ll cover the Tableau Cloud environment, connecting to and preparing your data for analysis, creating a workbook and sharing those insights with others.
Not sure what your user level is? To check, select the icon in the top right corner of the site with your initials or profile picture and select My Account Settings. Site Role tells you if you are a Creator, Explorer, or Viewer.
Step 1: Sign in and explore projects
To get started, enter your user name and password to sign in to your Tableau site. Then, from the navigation pane, click Explore to see all the content you have access to across the site.
Initially, you will see Top-Level Projects. You can browse these projects or select other content types.
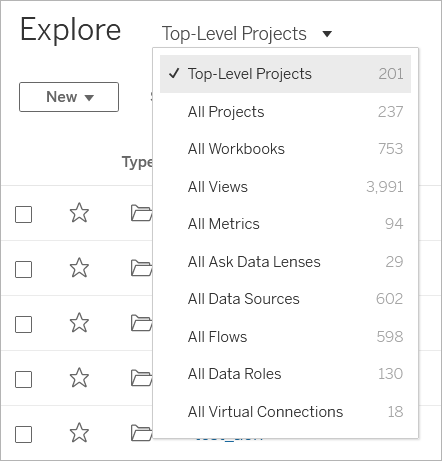
Workbooks, data sources, data roles, and flows can be saved to locations called projects. Projects can also contain nested projects. Much like folders on your desktop, projects are a way to sort and manage content in your site. If you've been invited to an existing site, you may see projects created by your teammates.
In addition to projects, you can privately save workbooks to a location called Personal Space. You can use Personal Space to create or explore workbooks, and move them to a project when you’re ready to share with others. For more information, see Create and Edit Private Content in Personal Space.
Both Personal Space and a default project are places for you to use for explorations if other projects are not available to you.
Starting in 2019.3, Tableau Catalog is available with Data Management in Tableau Server and Tableau Cloud. When Tableau Catalog is enabled in your environment, in addition to navigating and connecting to data from Explore, you can navigate and connect to more kinds of data, like databases and tables, from External Assets. For more information about Tableau Catalog, see "About Tableau Catalog" in the Tableau Server or Tableau Cloud Help.
Step 2: Create a new workbook and connect to data
In some way, you'll need to connect to data in order to analyze it and build a workbook. As a Creator, Tableau lets you connect to data sources directly on the web, or you can connect to data sources published to Tableau Cloud through Tableau Desktop.
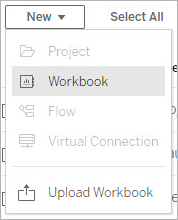
To begin, click the New button and select Workbook.
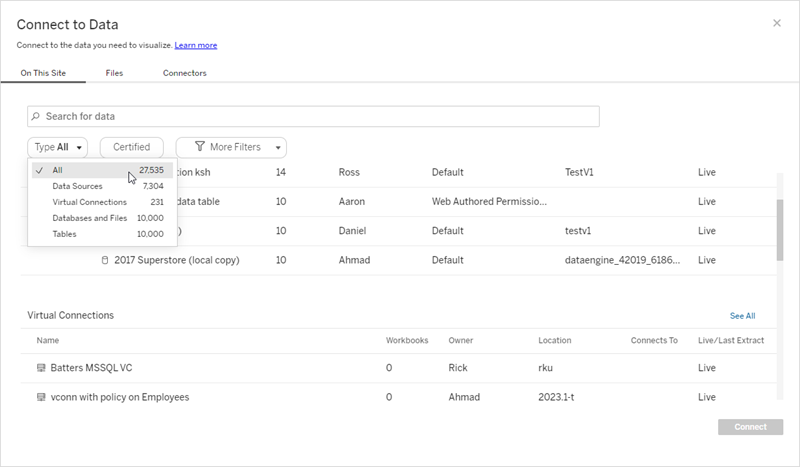
The Connect to Data dialog displays a scrollable list of mixed content that's popular. If you have a Data Management license, you can connect to data with a virtual connection, and if you have Data Management with Tableau Catalog enabled, you can also connect to external assets, like databases, files, and tables.
The responsive search field shows a list of suggestions that updates as you enter text. Filter search results by type of data, certification status, or other filters that depend on the type of data selected. For example, some types of data may allow you to filter based on tags, connection type, data quality warnings, or other criteria. Older versions of the dialog look and function slightly differently, but the overall function is similar.
You can connect to the data that will power your workbook in several ways:
-
Connect to published data sources from the On This Site tab.
If you have a Data Management license, you can connect to data with a virtual connection, and if you have Data Management with Tableau Catalog enabled, you can also connect to external assets, like databases, files, and tables.
- Upload Excel or text-based data sources from the Files tab.
-
Connect to server or cloud data sources from the Connectors tab.
-
On Tableau Cloud, quickly author and analyze data from LinkedIn Sales Navigator, Oracle Eloqua, Salesforce, ServiceNow ITSM, and Marketo from the Dashboard Starters tab.
To learn more about connecting to data on the web, see Creators: Connect to Data on the Web.
Tableau Catalog users create workbooks from external assets
When you have Data Management with Tableau Catalog enabled, you can create a new workbook when you're making a Catalog-supported connection from the External Assets page:
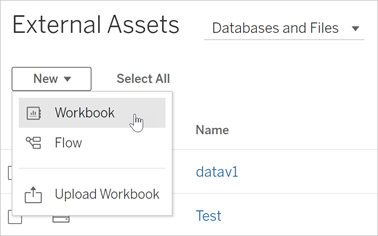
And from database and table pages:
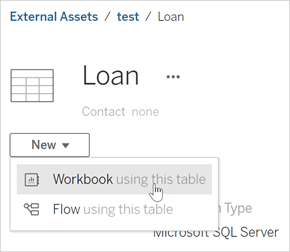
If Catalog doesn't support the connection, New Workbook doesn't appear.
Step 3: Prepare your data
After you have connected to data, use the data source page to prepare your data for analysis.
Parts of the data source page
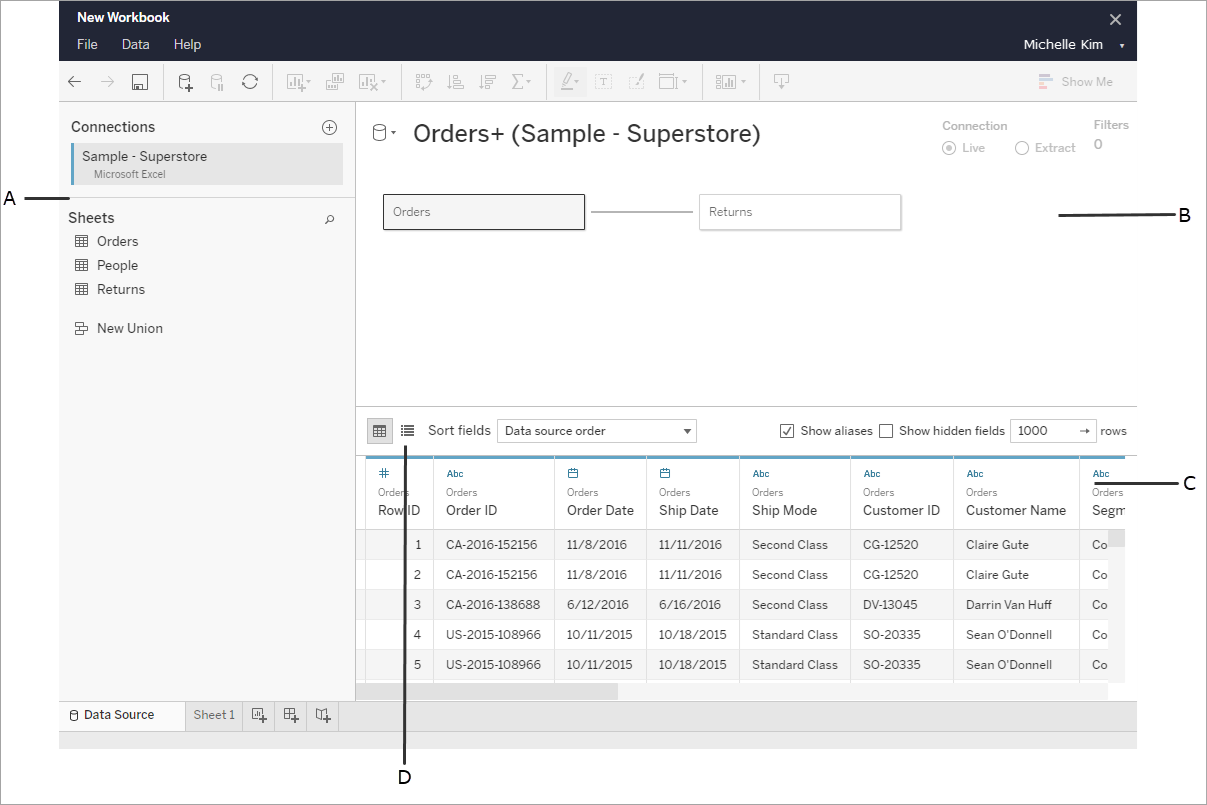
There are four areas of the data source page:
-
Left pane: Displays details about your data. For file-based data, the left pane might display the file name and the worksheets in the file. For relational-based data, the left pane might display the server, the database or schema, and the tables in the database.
-
Canvas: When connected to most relational and file-based data, you can drag one or more tables to the canvas area to set up your Tableau data source for analysis.
-
Data grid: You can use the data grid to review the fields and the first 1,000 rows of the data contained in the Tableau data source.
-
Metadata grid: The button takes you to the metadata grid, which displays the fields in your data source as rows so you can look at its structure.
You can prepare your data for analysis in the data source page by:
-
Renaming your data source
-
Cleaning your data using the Data Interpreter
-
Setting text file options
-
Relating your data
-
Editing data columns
To learn more about preparing your data for analysis on the web, see Creators: Prepare your Data on the Web.
Once your data is ready for analysis, click on Sheet 1 at the bottom of the screen to be taken to the Tableau workspace to build a view.
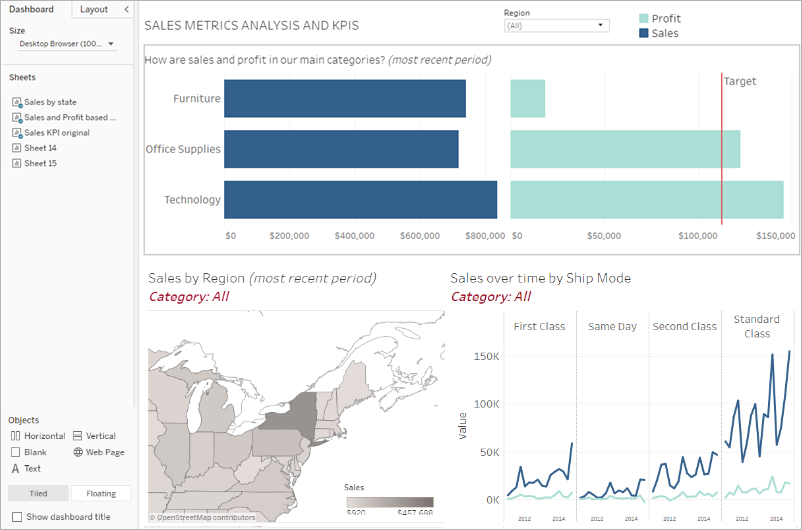
Step 4: Author a view
You've connected to data, you've set it up for analysis, and now you're ready to create a visual analysis of your data. Tableau calls this a view. If you've used Tableau Desktop before, the workspace area is very similar.
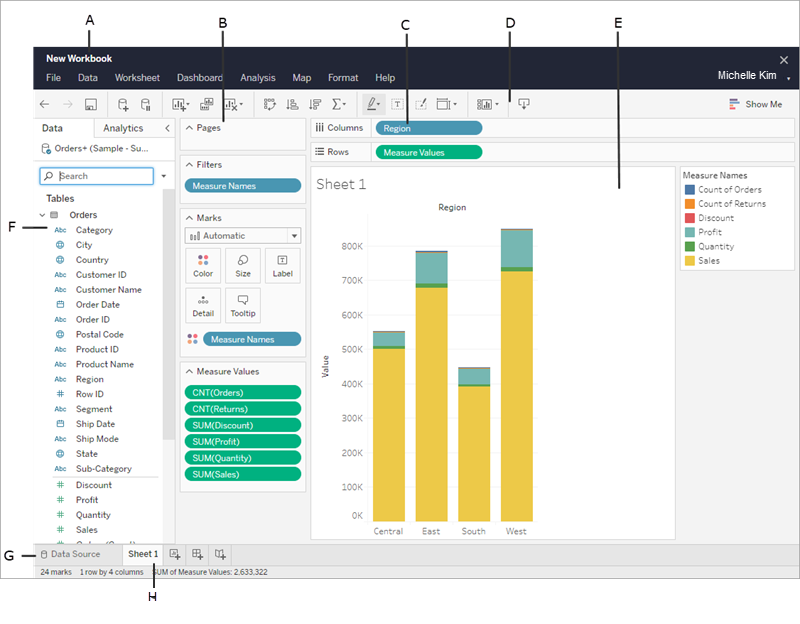
Workspace area
This is the layout of the Tableau workspace:
-
Workbook name. A workbook contains sheets. A sheet can be a worksheet, a dashboard, or a story. For more information, see Workbooks and Sheets.
-
Pages shelf, Filters shelf, Marks card - Drag fields to the cards and shelves in the workspace to add data to your view. For more information, see Shelves and Cards.
-
Columns and Rows shelf - Drag fields to the cards and shelves in the workspace to add data to your view. For more information, see Shelves and Cards.
-
Toolbar - Use the toolbar to access commands and analysis and navigation tools. See the Tableau Toolbar Button reference.
-
View - This is the workspace where you create your data visualizations.
-
Side Bar - In a worksheet, the side bar area contains the Data pane and the Analytics pane.
-
Go to the data source page. For more information, see Creators: Preparing Data on the Web.
-
Sheet tabs - Tabs represent each sheet in your workbook. This can include worksheets, dashboards, and stories.
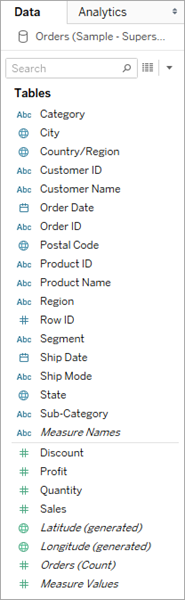
Starting in Tableau 2020.2: For each table or folder in the Data pane, a gray line separates dimensions (above line) and measures (below line). The Dimensions and Measures labels are no longer used in the Data pane.
Different ways to start building a view
Every time you drag a field into the view or onto a shelf, you are asking a question about that data. The question will vary depending on where you drag various fields, the types of fields, and the order in which you drag fields into the view.
For every question you ask, the view changes to represent the answer visually - with marks (shapes, text, hierarchies, table structures, axes, color).
In the worksheet, the columns from your data source are shown as fields on the left side in the Data pane. The Data pane contains a variety of different kinds of fields, organized by table.
When you build a view, you add fields from the Data pane. You can do this in different ways. For example:
-
Drag fields from the Data pane and drop them onto the cards and shelves that are part of every Tableau worksheet.
-
Double-click one or more fields in the Data pane.
-
Select one or more fields in the Data pane and then choose a chart type from Show Me, which identifies the chart types that are appropriate for the fields you selected. For more information, see Show Me.
Filtering data
You might want to filter your data to only display a certain amount in your view. You can filter your data in a number of ways, including:
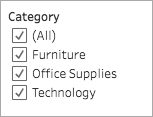
When you add fields to the filter Shelf, an interactive filter appears in the view. You can then select the items you want to include or exclude in the view.
-
To create a filter in Tableau on the web, drag a dimension, measure, or date field to the filter shelf.
When you add a field to the filters shelf, an interactive filter appears in the view. You can select items you want to include or exclude from the view, or select a range of values.
-
You can also interact with a published view by selecting a single mark (data point) or click and drag in the view to select several marks. On the tooltip that appears, you can select Keep Only to keep only the selected marks in the view, or select Exclude to remove the selected marks from the view.
For more information about filtering in Tableau, including Tableau's order of operations, see Filter Data from Your Views.
Using the Marks card
You can use the Marks card to add context and details to the marks in your view. You use the Marks card to set the mark type, and to encode your data with color, size, shape, detail, and text.
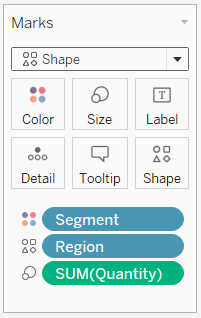
After you add a field to the Marks card, you can click the icon next to the field to change the property it is using. You can also click the property buttons in the Marks card to change those settings.

Many properties can have multiple fields. For example, you can add multiple fields to Label, Detail, Tooltip, and Color. Size and Shape can only have one field at a time. For more information, see Mark Properties Reference.
Undo your work
Tableau is extremely flexible and very forgiving. As you build a view, if you ever take a path that isn't answering your question, you can always undo to a previous point in your exploration.
-
To undo or redo, click undo
 or redo
  on the toolbar.
You can undo all the way back to the last time you opened the workbook. You can undo or redo an unlimited number of times.
Build and edit views on the web
There are many ways to explore data in Tableau. For instructions on building specific chart types on the web, see Edit Tableau Views on the Web, or for more features available to help you build a visualization in Tableau, see Build and Explore Data Views.
Step 5: Present your work
There are several ways to tell a story or persuade others with the data insights you've found in your views.
Format your work
You can format almost everything you see on a workbook, including parts of a view, your workbook's fonts, and graph lines.
Dashboards
A dashboard is a collection of several worksheets and supporting information shown in a single space so you can compare and monitor different data simultaneously.
To open a new dashboard sheet and start creating a dashboard, click the New Dashboard icon at the bottom of the workbook:
![]()
The Dashboard area appears on the left and lists the sheets in your workbook. You can add one or more views to a dashboard, add objects like web pages, blank space, and layout containers, or interactivity to associate different views on your sheet.
Stories
A story is a sheet than contains a sequence of worksheets and dashboards that work together to convey information. You can use stories to make a compelling case by showing how facts are connected, and how decisions create stories to tell a data narrative, provide context, demonstrate how decisions relate to outcomes, or make a compelling case with your data.
Create a story or learn more about stories.

Step 6: Save your work
You can save your workbook at any time by selecting File > Save As. Your workbook will save into the folder it was created in.
You can also save your data source to create another workbook later, or enable members of your team to use that data for their own analysis.
To save a data source, hover over the data source name in the Data tab in the workspace until an arrow appears. Select the arrow and select Save.
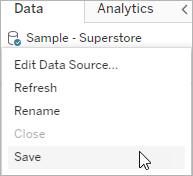
Note: When you save a data source on the web, it will appear as a published data source in the Connect to Data window as well as in the Data Sources section.
When you're finished, select File > Close to exit the workspace.
Step 7: Collaborate and share your findings
There are a number of ways to share your work and stay up-to-date.
Collaborate
Other Creators or Explorers in your organization can edit or update your workbooks and views if they have been given access to the project where the workbook is located. Access is controlled by your site's administrator, who can set project permissions, move content between projects, and change a user's role. If you've saved your data source, those users can connect to your data and use it to create new workbooks.
Share Views and Insights
Every view or workbook saved to your site can be shared via links in email and other applications, or can be embedded directly into web pages, wikis, and web applications.
To see a view, users must have permission to access it in Tableau Server or Tableau Cloud.
Learn how to:
-
Share web views (link to a view or embed a view).
-
Subscribe to Views to receive a snapshot of it by email at regular intervals.
-
Create Data-Driven Alerts to receive email notifications when data reaches important thresholds.
-
Comment on views to share a conversation with other users.
-
Embed views and dashboards into webpages.