View Underlying Data
When you see a Tableau visualization, do you wonder what data makes up each mark or even the entire viz? A typical viz contains aggregated measures based on the structure of the dimensions in the view. Every mark you see in a viz has underlying column and row data. The View Data window displays this data in a tabular format, scoped to the current selection or the current view.
If you have the required permissions, you can view underlying data in a worksheet, sheets in a dashboard, or in the Data Source page. In the worksheet, you can customize the View Data window and download that customized view in CSV format.
Note: Customized sort results aren't included in the downloaded data.
By default, the View Data window displays up to 10,000 rows of data in Tableau Desktop and up to 200 rows of data in Tableau Cloud and Tableau Server.
Note: Starting in Tableau version 2020.2, when you open a data source from Tableau version 2020.1 or earlier, the column order might be different. Columns might be displayed differently in the View Data window, and the column order might be different when you export it to CSV format. In Tableau version 2022.1 and later, you can manually customize the column order before you export the data.
This change in how column order is handled in the View Data window is required to support relationships and logical tables. If you use scripts that depend on a customized column order, we recommend using the Tableau Extensions API for View Data to download underlying data to CSV format.
Where you can open the View Data window
The data you see in the View Data window varies depending on the context of where you open it.
| Context | Scope | How |
|---|---|---|
|
Worksheet: Selected Mark or Marks Tableau Cloud, Tableau Server, Tableau Desktop |
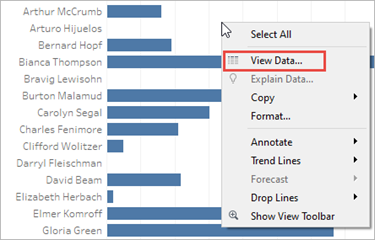
In a worksheet, selecting one or more marks and then selecting View Data from the tooltip menu displays underlying data scoped to the individual mark or a group of marks. Note: The Include command buttons option must be selected for tooltips for the View Data button to be available. This view can be customized and downloaded. |
Select one or more marks in the view, and then select View Data from the tooltip menu.
|
|
Data Source page: Per Table Tableau Cloud, Tableau Server, Tableau Desktop |
In the Data Source page, you can open View Data for each table listed in the data source (left pane). You can move and sort columns in this view, but you can't download the data. |
Select View Data next to a table in the left pane of the Data Source page.
You can also display the View Data window for custom SQL by clicking Preview Results in the Custom SQL dialog box. |
|
Worksheet: Download button on toolbar Tableau Cloud and Tableau Server |
In a worksheet (viewing or editing mode), selecting Data from the Download button menu displays all underlying data used in a viz. In a dashboard, underlying data can be viewed based on the selected worksheet. Select a sheet in the dashboard before you click the Download button to make the Data option available. This view can be customized and downloaded. |
From the Download button menu, select Data.
|
|
Worksheet: Data pane Tableau Desktop only |
In a worksheet, selecting View Data at the top of the Data pane displays tabular data for each field in the data source, listed by table. This view can be customized and downloaded. |
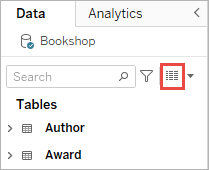
In the Data pane, click the View Data button next to the Search field.
|
|
Worksheet: Analysis menu Tableau Desktop only |
In a worksheet, selecting View Data from the Analysis menu displays all underlying data used in a viz. The corresponding table or tables for measures used in the viz are listed in the Tabs pane. This view can be customized and downloaded. |
From the Analysis menu, select View Data. In vizzes that aren't text tables, you also can right click the view, and then select View Data.
|
Open View Data in a worksheet
When you open View Data in a worksheet, you can customize the display of the View Data window and download that customized view.
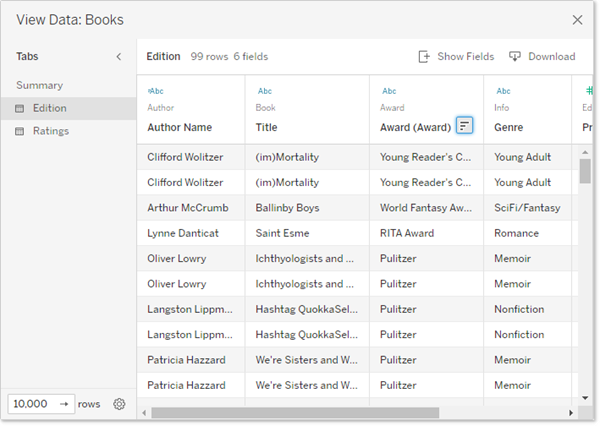
The View Data window displays multiple tabs on the left side of the window. The number of tabs and types of tabs vary depending on the current scope.
- The Summary tab displays the dimensions that define the view and the aggregated measure or measures that make up the mark.
When more than one continuous date field is used in a view, the rows for field values won't be merged in the summary data. This behavior applies to continuous dimensions in general, but most commonly will occur with date fields. - A tab for each table that has a measure present in the view, showing all fields from that table.
The Full Data tab is displayed for single table data sources.
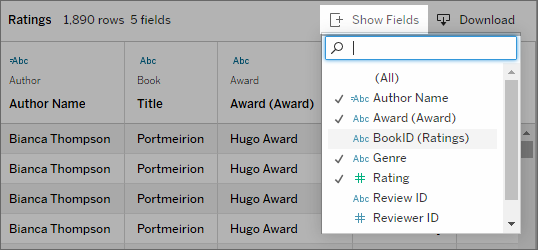
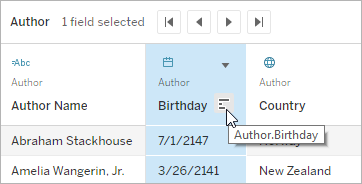
To show all fields, select (All) under Show Fields. When (All) is selected, each tab shows all dimensions that define the view, regardless of which table they’re from. - Field names are shown as column headers. Hover near the top of a column to display the drop-down menu and Sort button. You can also click anywhere in a column header to display its drop-down menu.
- Some calculations used in the view might be displayed on tabs as well:
- Calculations that don't belong with a table in the Data pane, such aggregate calculations or calculations that span tables.
- LOD calculations (
FIXEDorINCLUDEonly), even if they reside in a table in the Data pane. Ad hoc LOD calculations aren't shown in View Data. - All relevant fields used in the calculation are displayed, regardless of their original table, as well as the value of the calculation itself.
Open View Data in a viz for one or more marks
Click a mark to display its tooltip. In the tooltip menu, click the View Data icon ![]() . You can also select multiple marks simultaneously and then click View Data in the tooltip menu see the combined View Data results.
. You can also select multiple marks simultaneously and then click View Data in the tooltip menu see the combined View Data results.
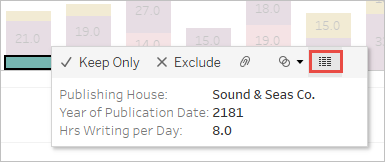
Note: The Include command buttons option must be selected for tooltips in the viz for the View Data button to be available.
Open View Data for the entire view
Tableau Cloud and Tableau Server
To see the underlying data for the entire view, in viewing or editing mode, click the Download button on the toolbar and then select Data. Make sure no marks are selected in the view, otherwise, the data is scoped to your selection.
In a dashboard, underlying data can be viewed based on the selected worksheet. Select a sheet in the dashboard before you click the Download button to make the Data option available.
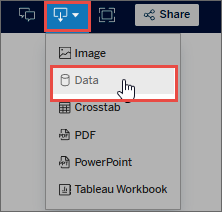
Tableau Desktop
To see the underlying data for the entire view, from the Analysis menu, select View Data. The View Data window is displayed with similar results for viewing data for a mark, but instead it displays all of the data in use in the view.
Open View Data for the Data pane
To see the underlying data for each field in the data source, listed by table, click the View Data icon ![]() in the top of the Data pane, next to the Search field.
in the top of the Data pane, next to the Search field.
You can open the View Data for the Data pane in Tableau Desktop only.
Open View Data in the Data Source page
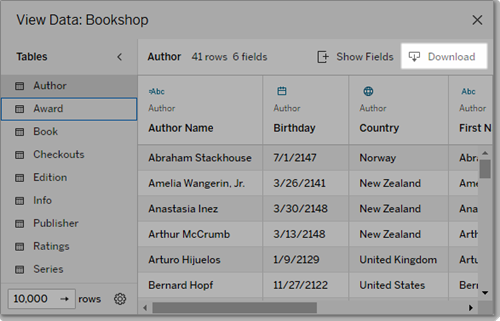
The View Data window can be opened per table for the data source. Viewing data for the data source before or during analysis can be useful to give you a sense of the scope of each table, its fields and their values, and general impressions about the data.
When you open View Data in the Data Source page, you can move and sort the field columns in the View Data window, but you can't download the data.
In the Data Source page, hover over a table or sheet in the left pane to display the View Data icon ![]() , and then click the icon.
, and then click the icon.
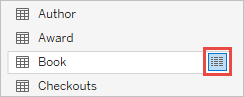
The View Data window displays the data for that table.
Customize the View Data window
All customization options are available when you open View Data in a worksheet and are used for downloaded data.
The customizations you make remain until you close the View Data window. Closing the View Data window discards all customizations.
Note: For the Data Source page, sorting and moving fields are the only options available for View Data.
| Option | How | Where |
|---|---|---|
|
Show or hide field columns |
Click Show Fields and check or uncheck a field name. To show all fields, select (All). Fields are added to the right of the currently displayed fields. |
|
|
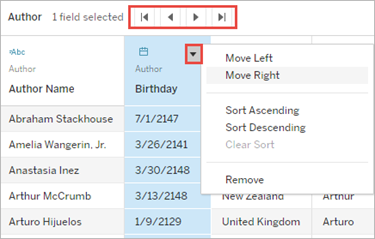
Move field columns |
Select one or more field columns and then click the right or left arrows at the top of the window. Or, select the drop-down menu and click Move Right and Move Left. Tip: To group nonadjacent columns together, press Ctrl while selecting the columns, and then move the selected columns to the left or right. |
|
|
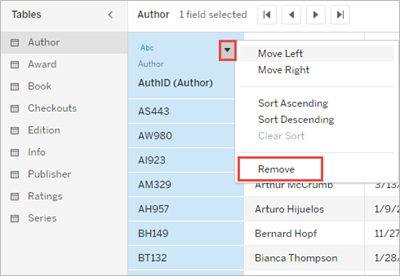
Remove field columns |
Select a field column and then select Remove from the drop-down menu. Or, click Show Fields and uncheck the field to remove its column. |
|
|
Sort data |
Hover near the top of a column to display the Sort button. Click the Sort button to change the sort. Optionally, click the drop-down menu and select Sort Ascending or Sort Descending Note: Customized sort results aren't included in downloaded data. |
|
|
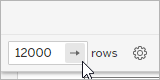
Edit the maximum number of rows displayed |
By default, the View Data window displays up to the first 10,000 rows of data in Tableau Desktop and up to the first 200 rows of data in Tableau Cloud and Tableau Server. You can increase or decrease the maximum number of rows displayed in the View Data window. This setting has no effect on the number of rows exported when you click the Download button. Click in the number of rows field to edit it. Click the arrow button or press Enter on your keyboard to apply the change. |
|
|
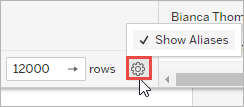
Show aliases |
Click the Settings button to show or hide aliases for all field names. |
|
Download data from the View Data window
To export all of the data for the selected tab, click the Download button.
The data is exported to a CSV file using the current configuration as the View Data window and isn't limited to the number of rows currently displayed in the View Data window.
Note: Customized sort results aren't included in downloaded data.
Null values are downloaded as empty strings.
Note: If you are a workbook author and want to ensure your audience can’t copy or download the underlying data, consider turning off the command buttons in the tooltips(Link opens in a new window) or denying workbook permissions(Link opens in a new window) to download the summary or full data.
Copy data from the View Data window
You can copy portions of the data from the View Data window for use in a spreadsheet or another Tableau workbook (really, anywhere you can paste text). Null values are copied as empty strings.
- Select cells of interest and press Ctrl+C (Windows) or Command+C (Mac), and then paste the data into a spreadsheet, another Tableau workbook, or another destination of your choice.
Note: If you want to download all of the values in the underlying data, click the Download button. Selecting and copying a column copies only values that are currently loaded in the View Data window and might not include all of the values in the underlying data.
Why can’t I see the View Data icon?
If you can't find the View Data icon for a mark, check that tooltips and tooltip menu command buttons are turned on. Specifically, the Show tooltips and Include command buttons options must be selected for tooltips in the viz for the View Data button to be available in a tooltip. Alternatively, right click a mark and select View Data from the drop-down menu. This method works when tooltips or command buttons aren’t enabled.
There are several reasons why the View Data icon for a mark might not be displayed in a published viz:
- Tooltips aren't enabled.
- Tooltip command buttons have been turned off.
- You might not have the necessary permissions to view data.