Blend Geographic Data
This example demonstrates how to blend geographic data in Tableau using two small sample data sources. Follow the steps in this topic to learn how to create a file that defines your geographic data, blend two data sources, and build the map view below using the two data sources.
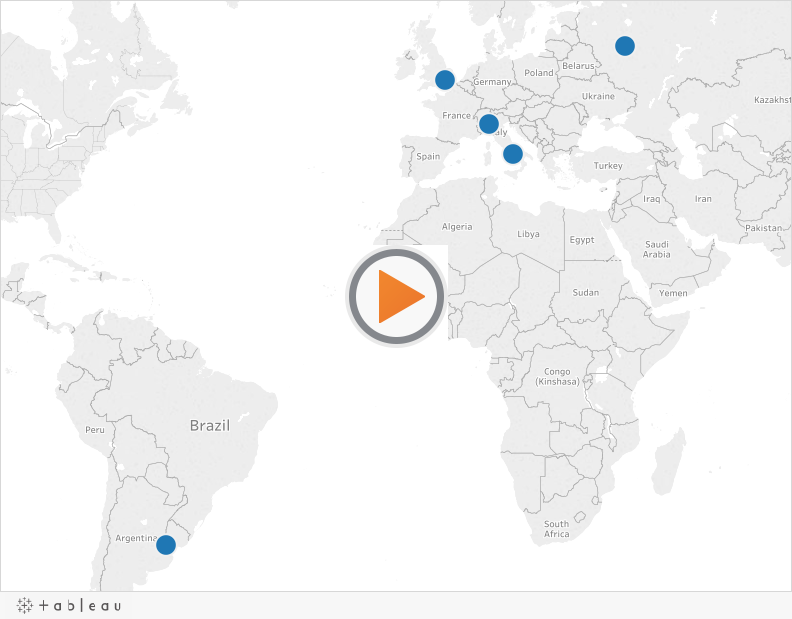
The embedded view below shows famous theaters around the world, and was created by blending geographic data with another data source. Hover over the marks in the view to see information about each theater. If you would like to follow along with the steps in this topic, click Download in the view below, and then select Tableau Workbook. This will open the view in Tableau Desktop.
Step 1: Create a file that defines your geographic data
When you have a data source that contains geographic information that is not automatically geocoded in Tableau, the first step is to create a second data source that defines the latitudinal and longitudinal values for that information. You will later connect to this file in Tableau Desktop and blend it with your original data source.
Create a second data source with the following information:
-
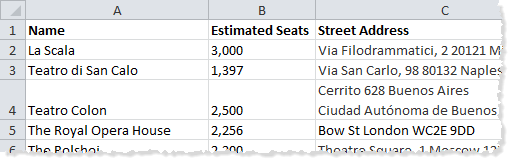
Geographic name column: This column includes any geographic information you want to plot on a map view and typically matches a geographic column name in your original data. For example, if your original data source has a column called Street Address, your second data source should also have a column called Street Address. The data in this column would then be all of the street addresses you want to plot on a map view.
If the column does not match a geographic column name in your original data source, you may need to edit the relationships between your two data sources in Tableau Desktop. For more information, see Step 3.
Finally, this column should not match the names of any geographic roles already in Tableau, such as County, Area Code, or CBSA/MSA.
Note: The data in these columns can be strings or numbers. However, if your locations are numbers, especially numbers with leading zeros (for example, 00501), make sure the data type of the field is set to String in Tableau. For more information, see Data Types(Link opens in a new window).
-
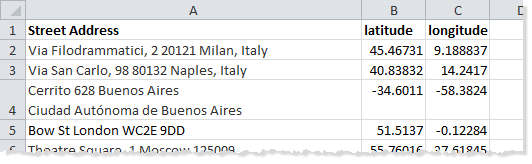
Latitude and Longitude columns: The values in these columns need to be in decimal degrees (for example, 47.651808, -122.356881).
Below is an example of an original data source with geographic locations, and a second data source that defines those geographic locations.
| Original data source | Second data source |
|
|
Step 2: Connect to the data sources
-
Connect to the original data source.
-
Connect to the data source that defines your geographic data.

Step 3: Edit Relationships
(Optional) If the two data sources share the same column names, your data should blend automatically when you add fields to the view. However, if the file you created to define your geographic data does not share the same column name as the geographic data in your original data source, you will need to create a relationship between those two fields using the Edit Relationships option. For information about how to edit relationships, see Blend Your Data.
Step 4: Plot the data on a map view
-
In the Data pane, select the second data source that defines your geographic data. Under Measures, assign the Latitude geographic role to the Latitude field and the Longitude geographic role to the Longitude field. For more information, see Assign Geographic Roles (Link opens in a new window).
-
In the Data pane, select the original data source, and then drag the field you want to plot on a map to Detail on the Marks card.
Note: This field should have a data type of String, and should be a dimension. For more information on how to change the data type of a field, see Data Types(Link opens in a new window).
-
In the Data pane, select the second data source , and then double-click Latitude and Longitude to add them to the Columns and Rows shelves.
The link icon
 indicates that the Street Address field is blended with the Street Address field in the original data source. A broken link icon
  indicates that the Street Address field is not blended with the Street Address field in the original data source.
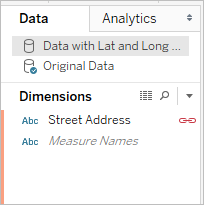
The view is now complete. Each mark represents an address from the original data source.

See also
Data Blending vs. Custom Geocoding(Link opens in a new window)