Create Filled Maps with Pie Charts in Tableau
The pie mark type can be useful to show simple proportions to a relative whole. For example, pie marks might be effective when you want to show the percentage of profit for a product by geographic location.
In this example, the pie mark type is used with the filled maps mark type to show the percentage of profit for office supplies, furniture, and technology, relative to the total profits by state. It uses the Sample-Superstore data source that comes with Tableau Desktop.
Build the map view using layers
-
In Tableau, open a new workbook and connect to the Sample-Superstore data source.
- On the Data Source page, click Sheet 1 to go to a new worksheet.
-
In the Data pane, under the Orders table, open the Location folder and double-click State.
Tableau creates a symbol map with a data point for each state in the Sample-Superstore data source.
-
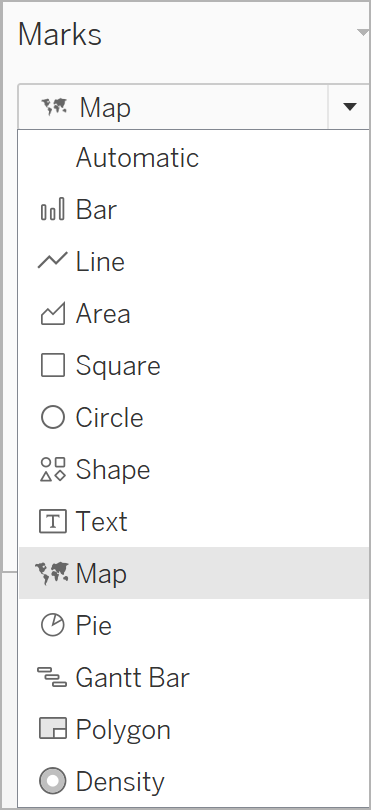
On the Marks card, click the Mark type drop-down and select the Map mark type.
-
From the Data pane, drag Profit to Color on the Marks card.
-
From the Data pane, under the Orders table, open the Location folder and drag State to the map. When the field is over the map, you’ll see an option to Add a Marks Layer. Drop State here to make a new layer.
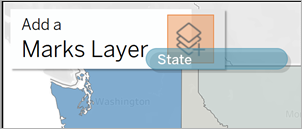
You now have a map with two layers: filled state polygons showing Profit and point locations in the middle of each state. We’ll turn these points into pie charts in the next steps.
- If you’d like to organize and name your layers, click the drop-down arrow to the right of the layer name, select Rename, and rename the layer to a name that reflects its content, for example, "Pie Chart."
-
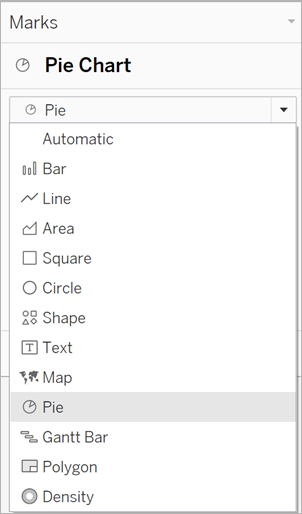
On the Pie Chart layer, click the Mark type drop-down and select the Pie mark type.
-
From the Orders table in the Data pane, drag Sales to Size on the Marks card on the Pie Chart layer.
The sum of sales for each state is shown in a proportionally sized circle.
-
Under the Orders table in the Data pane, open the Product folder and drag Category to Color on the Marks card.
Tip: If pie charts are too small, click Size on the Marks card and adjust the size.
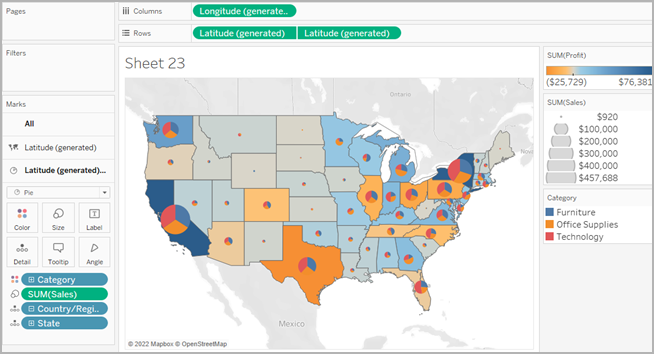
The map updates to show the sum of profit and the sum of sales for each category and state.
Build the map view using a dual axis
-
In Tableau, open a new workbook and connect to the Sample-Superstore data source.
- On the Data Source page, click Sheet 1 to go to a new worksheet.
-
In the Data pane, under the Orders table, open the Location folder and double-click State.
Tableau creates a symbol map with a data point for each state in the Sample-Superstore data source.
-
On the Marks card, click the Mark type drop-down and select the Map mark type.
-
From the Data pane, drag Profit to Color on the Marks card.
-
From the Data pane, drag Latitude (generated) to the Rows shelf, and place it to the right of the other Latitude field.
You now have two identical map views.
-
On the Rows shelf, right-click the second Latitude field and select Dual Axis.
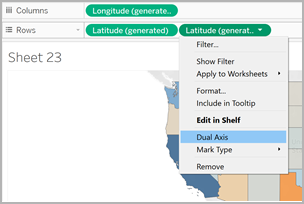
The second map is now layered on top of the first map. There are now three drop-downs on the Marks card: one for each map view, and one for both views (All). These are three separate marks cards that you can use to control the visual detail for each of the map views.
-
On the Marks card, click one of the Latitude (generated) tabs, and then click the Mark type drop-down and select the Pie mark type.
-
From the Orders table in the Data pane, drag Sales to Size on the Latitude (generated) Marks card you selected.
The sum of sales for each state is shown in a proportionally sized circle.
-
Under the Orders table, open the Product folder and drag Category to Color on the same Marks card.
Tip: If the pie charts are too small, click Size on the Marks card to adjust the size.
The map view now shows the sum of profit, as well as the sum of sales for each category, for each state.
See also:
Mapping Concepts in Tableau(Link opens in a new window)
Get Started Mapping with Tableau(Link opens in a new window)