Set Actions
Use set actions to let your audience interact directly with a viz or dashboard to control aspects of their analysis. When someone selects marks in the view, set actions can change the values in a set. For examples on how set actions can be used, see Examples of set actions.
Set actions take an existing set and update the values contained in that set based on user actions in a viz. You can define the set action to include:
- the source sheet or sheets it applies to.
- the user behavior that runs the action (hover, select, or menu).
- the target set (the data source and set to be used).
- what happens when the selection is cleared.
To change or affect a visualization, the set referenced in the action must be used somehow in the visualization. You can do this in different ways, such as using the set in a calculated field that you then use to build the viz, or by placing the set in the view or on a Marks card property.
You can create set actions in Tableau Desktop, Tableau Cloud, and Tableau Server. However, set actions can't be used with Stories.
General steps for set actions
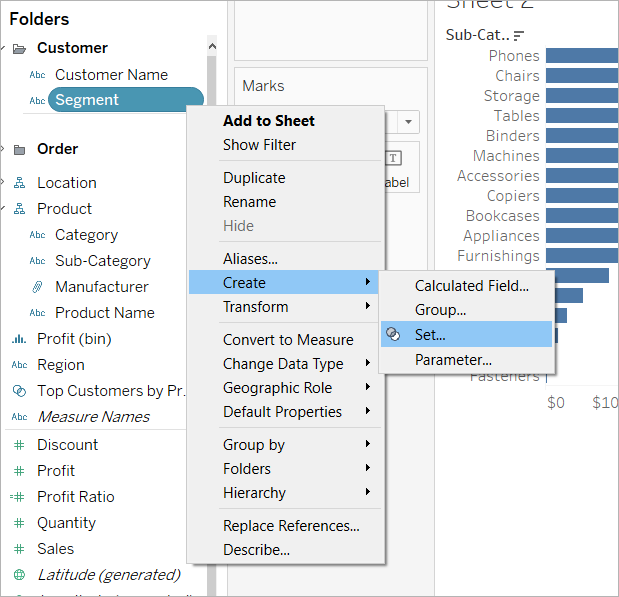
Create one or more sets. The sets you create will be associated with the data source that is currently selected. For details on creating sets, see Create Sets.
Create a set action that uses one of the sets you created. You can create multiple set actions for different purposes.
Depending on the behavior you want to make available to users for their analysis, you might want to create a calculated field that uses the set. For details on creating calculated fields, see Create a calculated field.
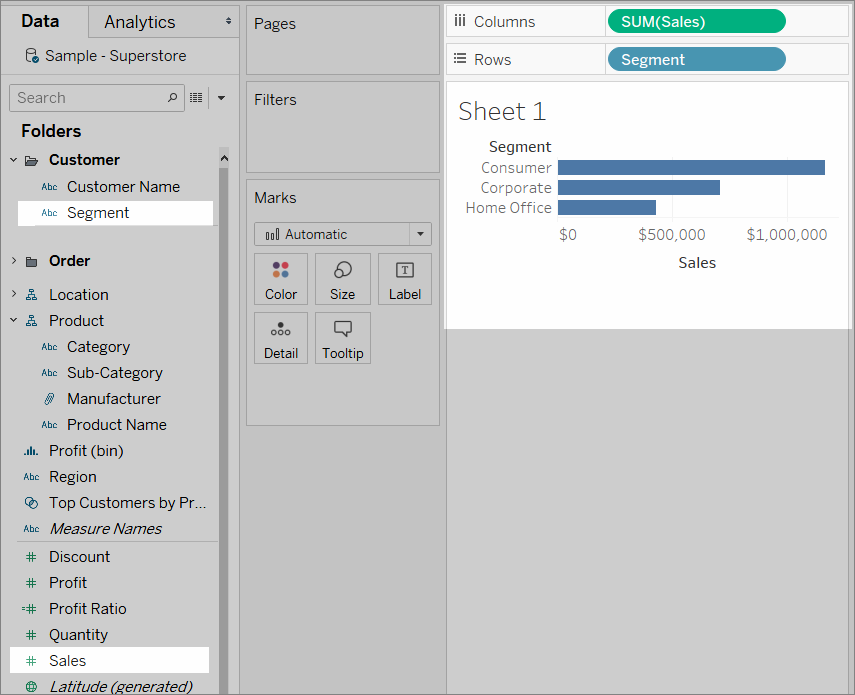
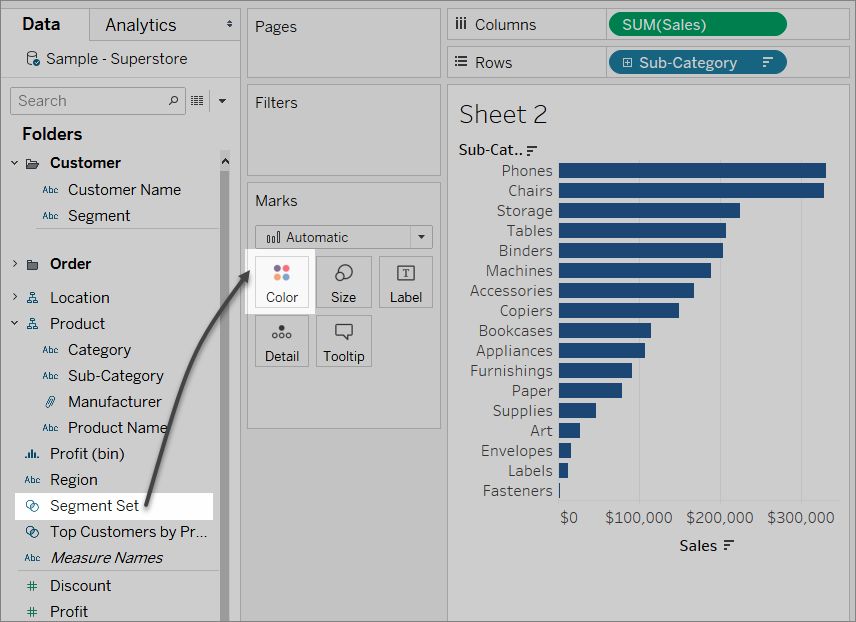
Build a visualization that uses a set referenced by a set action. For example, if you create a calculated field that uses the set, build the view using that calculated field. Or, drag the set to Color in the Marks card.
Test the set action and adjust its settings as needed to get the behavior you want your audience to experience.
Getting Started: For an overview of what you need to know to create set actions, see On Your Marks, Get Set, Go: Everything You Need to Know to Get Started with Set Actions(Link opens in a new window) on the Data Viz Linds(Link opens in a new window) blog.
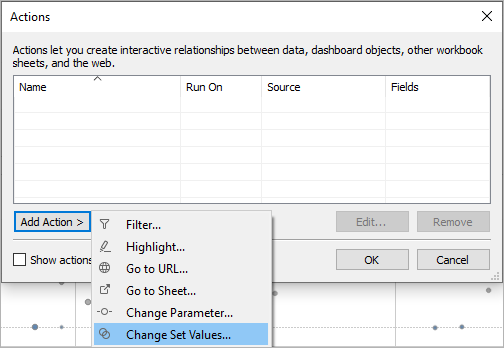
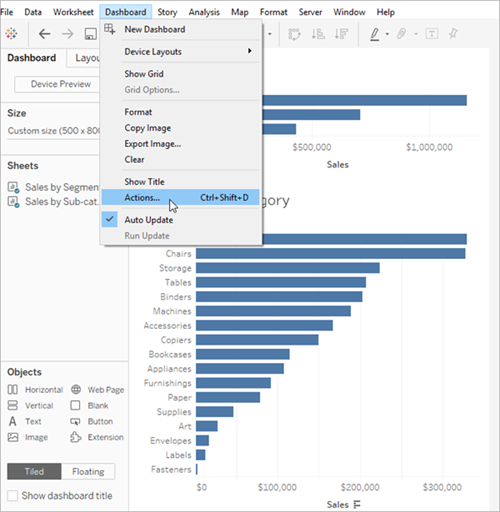
In a worksheet, select Worksheet >Actions. In a dashboard, select Dashboard >Actions.
In the Actions dialog box, click Add Action and then select Change Set Values.
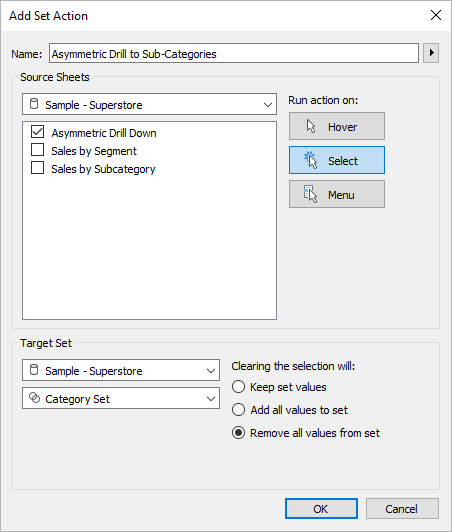
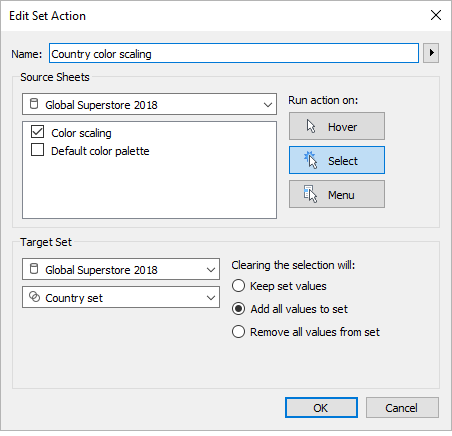
In the Add/Edit Set Action dialog box, specify a meaningful name for the action.
Select a source sheet or data source. The current sheet is selected by default. If you select a data source or dashboard you can select individual sheets within it.
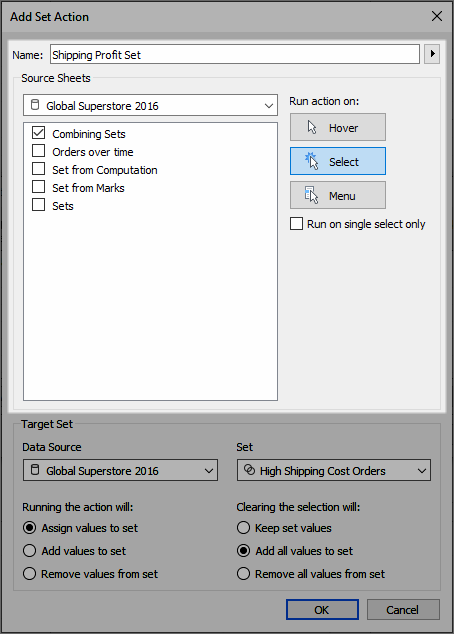
Select how users will run the action.
Hover - Runs when a user hovers the mouse cursor over a mark in the view.
Select - Runs when a user clicks a mark in the view. This option works well for set actions.
Menu - Runs when a user right-clicks (control-clicks on Mac) a selected mark in the view, then selects an option on the context menu.
Specify the target set. First, select the data source, and then select the set.
The sets available in the Target Set lists are determined by the data source that you select and the sets that you have created in the workbook that are associated with that data source.
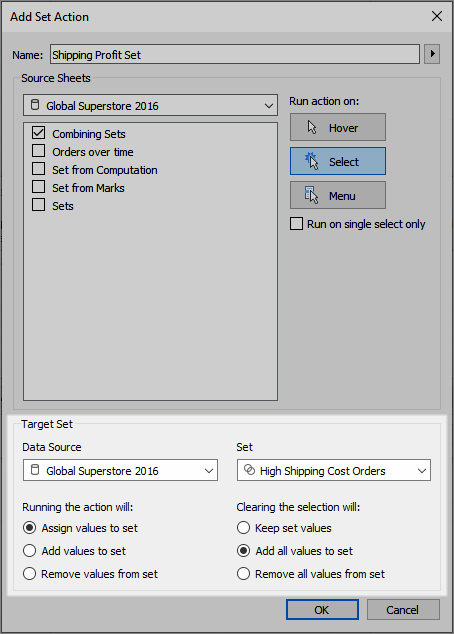
In this example, the target set is using Global Superstore 2016 as the data source and High Shipping Cost Orders as the set.
Specify what happens when the action is run in the view:
Assign values to set - Replaces all values in the set with the values selected.
Add values to set - Adds individually selected values to the set.
Remove values from set - Removes individually selected values from the set.
Specify what happens when the selection is cleared in the view:
Keep set values - Current values in the set remain in the set.
Add all values to set - Adds all possible values to the set.
Remove all values from set - Removes previously selected values from the set.
Click OK to save your changes and return to the view.
Test the set action by interacting with the visualization. Tweak some of the settings for the action to adjust the selection behavior as needed.
Note: Selecting Add values to set or Remove values from set via the Set Action dialog modifies the values selected in the General tab of the set’s definition—just like Assign values to set does. This differs from the Add to and Remove from functionality available only in authoring mode via the set’s context menu in the tooltip. The latter unions or removes values to and from the set after the condition specified has been applied.
The following examples show just a few of the ways you can use set actions. To follow along, you will need to be familiar with creating and using sets and calculated fields. For details, see Create Sets and Create a calculated field.
Learn more: For additional in-depth examples of how you can use set actions demonstrated in Tableau, see:
- 8 ways to bring powerful new comparisons to viz audiences with set actions(Link opens in a new window) in the Tableau blog(Link opens in a new window)
- 8 analytic concepts to express with Tableau set actions(Link opens in a new window) (Tableau blog)
- Designing advanced analytics applications with Tableau set actions(Link opens in a new window) (Tableau blog)
- Topics on set actions on the Data Viz Linds(Link opens in a new window) blog
- Set action examples in the Art of the Vizable(Link opens in a new window) website by TabLabs.
Watch a video:
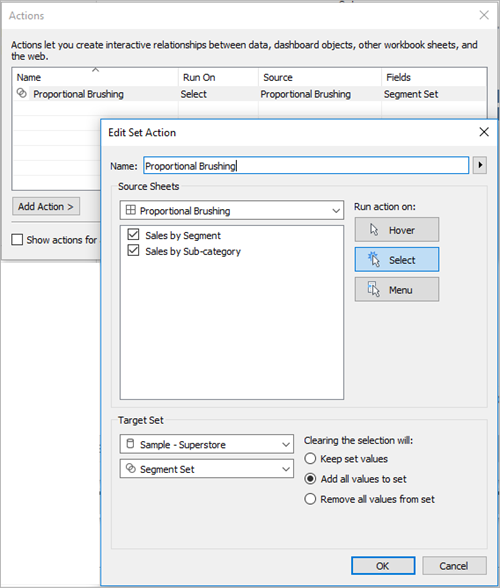
Proportional brushing
A classic use case for set actions is proportional brushing, described in How to do proportional highlighting with set actions(Link opens in a new window) on the Tableau blog(Link opens in a new window) and Tableau Set Actions(Link opens in a new window) from The Information Lab blog(Link opens in a new window) (along with other examples).
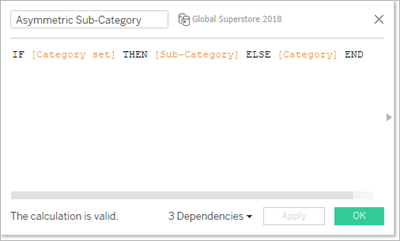
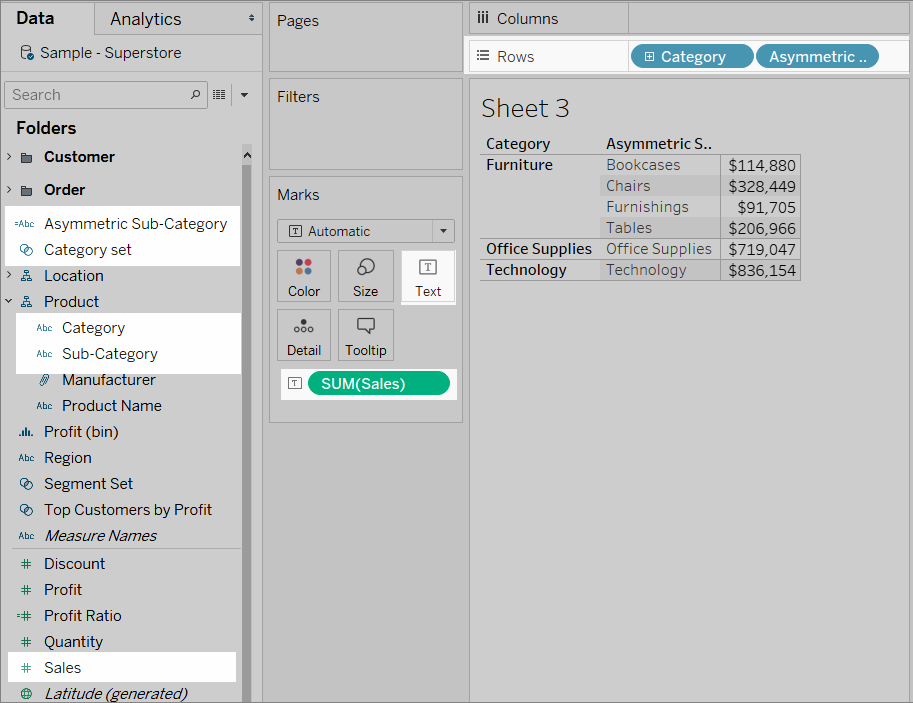
Asymmetric drill down
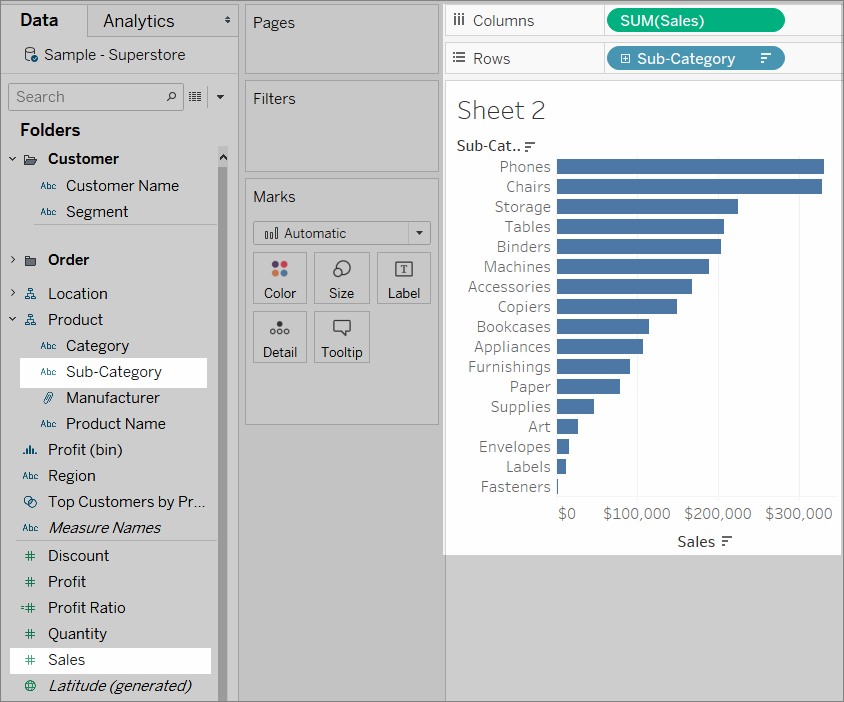
Set actions can also be used across multiple sets for more complex interactions. If a data set has hierarchical information, such as Category, Sub-Category, and Manufacturer, normally drilling down the hierarchy expands all values at a given level. However, you can use set actions for asymmetric drill down, opening only the next hierarchy level for the selected value.
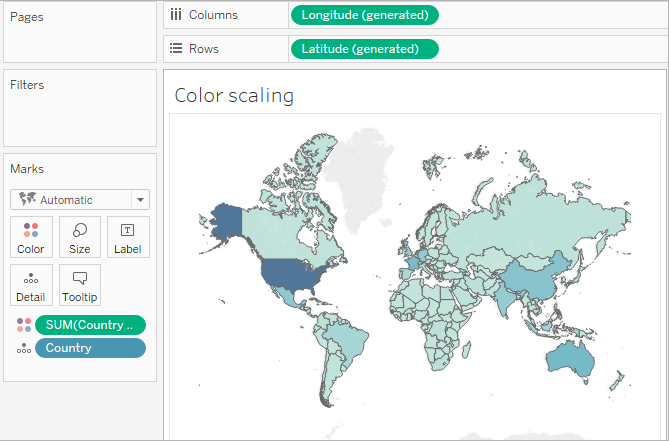
Color scaling
Color values in a viz often can be distorted by outliers. When one country has a significantly higher value than other countries, the nuance of differences between those non-extreme values can be lost.
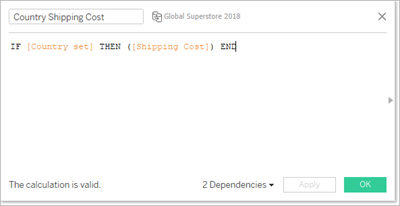
A set action can update the values in a Country set based on the selection in the viz. That set is then used in a calculated field that computes the value of the relevant measure for only countries in that set, and that calculated field is placed on color. Now, when countries are selected in the map, the color palette is based only on those countries, showing greater visual differences between those values.
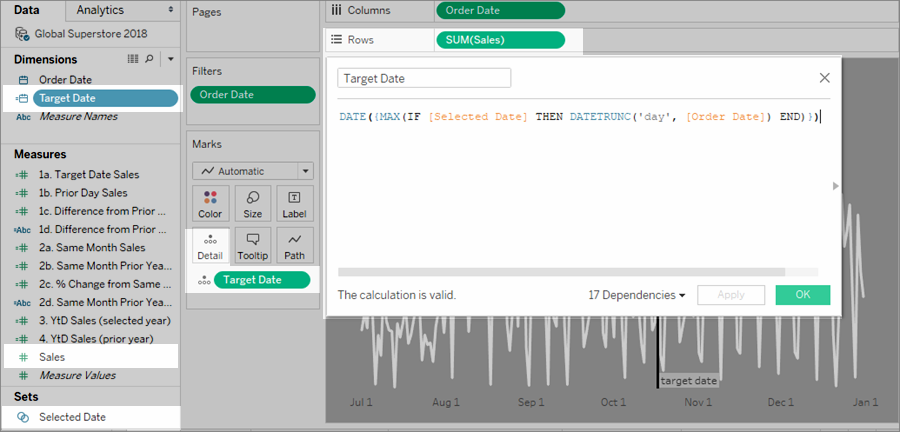
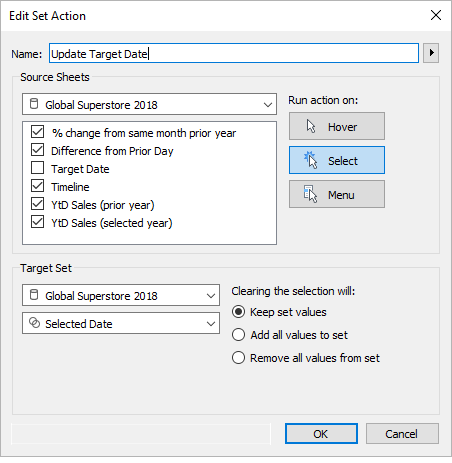
Relative dates
This dashboard example contains multiple relative date calculations. Based on a target date, the dashboard displays the difference from the previous day, the percent change from the same month in the previous year, the Year to Date sales for the current year, and Year to Date sales for the previous year.
The set action in this dashboard updates the target date and relevant date calculations in response to a user clicking a mark on a timeline.