Types of Calculations in Tableau
This article explains the types of calculations you can use in Tableau. You'll learn the difference between each calculation and how they are computed.
There are three main types of calculations you can use to create calculated fields in Tableau:
Basic expressions allow you to transform values or members at the data source level of detail (a row-level calculation) or at the visualization level of detail (an aggregate calculation).
For example, consider the following sample table, which contains data on two fantasy authors and their books. Perhaps you want to create a column with only the author's last name and a column that displays how many books are in each series.
| Book ID | Book Name | Series | Year Released | Author |
| 1 | The Lion, the Witch and the Wardrobe | The Chronicles of Narnia | 1950 | C.S. Lewis |
| 2 | Prince Caspian: The Return to Narnia | The Chronicles of Narnia | 1951 | C.S. Lewis |
| 3 | The Voyage of the Dawn Treader | The Chronicles of Narnia | 1952 | C.S. Lewis |
| 4 | The Silver Chair | The Chronicles of Narnia | 1953 | C.S. Lewis |
| 5 | The Horse and His Boy | The Chronicles of Narnia | 1954 | C.S. Lewis |
| 6 | The Magician's Nephew | The Chronicles of Narnia | 1955 | C.S. Lewis |
| 7 | The Last Battle | The Chronicles of Narnia | 1956 | C.S. Lewis |
| 8 | Daughter of the Forest | Sevenwaters | 1999 | Juliet Marillier |
| 9 | Son of the Shadows | Sevenwaters | 2000 | Juliet Marillier |
| 10 | Child of the Prophecy | Sevenwaters | 2001 | Juliet Marillier |
| 11 | Heir of Sevenwaters | Sevenwaters | 2008 | Juliet Marillier |
| 12 | Seer of Sevenwaters | Sevenwaters | 2010 | Juliet Marillier |
| 13 | Flame of Sevenwaters | Sevenwaters | 2012 | Juliet Marillier |
Row-level calculations
To create a column that displays the author's last name for every row in the data source, you can use the following row-level calculation that splits on a space:
SPLIT([Author], '', 2 )
The result can be seen below. The new column, titled Author Last Name is shown on the far right. The colors demonstrate the level of detail the calculation is performed at. In this case, the calculation is performed at the row-level of the data source, so each row is colored separately.
| Book ID | Book Name | Series | Year Released | Author | Author Last Name |
| 1 | The Lion, the Witch and the Wardrobe | The Chronicles of Narnia | 1950 | C.S. Lewis | Lewis |
| 2 | Prince Caspian: The Return to Narnia | The Chronicles of Narnia | 1951 | C.S. Lewis | Lewis |
| 3 | The Voyage of the Dawn Treader | The Chronicles of Narnia | 1952 | C.S. Lewis | Lewis |
| 4 | The Silver Chair | The Chronicles of Narnia | 1953 | C.S. Lewis | Lewis |
| 5 | The Horse and His Boy | The Chronicles of Narnia | 1954 | C.S. Lewis | Lewis |
| 6 | The Magician's Nephew | The Chronicles of Narnia | 1955 | C.S. Lewis | Lewis |
| 7 | The Last Battle | The Chronicles of Narnia | 1956 | C.S. Lewis | Lewis |
| 8 | Daughter of the Forest | Sevenwaters | 1999 | Juliet Marillier | Marillier |
| 9 | Son of the Shadows | Sevenwaters | 2000 | Juliet Marillier | Marillier |
| 10 | Child of the Prophecy | Sevenwaters | 2001 | Juliet Marillier | Marillier |
| 11 | Heir of Sevenwaters | Sevenwaters | 2008 | Juliet Marillier | Marillier |
| 12 | Seer of Sevenwaters | Sevenwaters | 2010 | Juliet Marillier | Marillier |
| 13 | Flame of Sevenwaters | Sevenwaters | 2012 | Juliet Marillier | Marillier |
Aggregate calculations
To create a column that displays how many books are in each series, you can use the following aggregate calculation:
COUNT([Series])
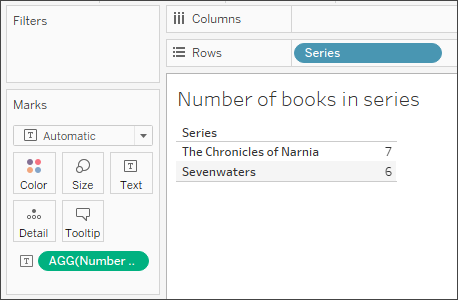
The result can be seen below. The new column, titled Number of Books in Series - at Series level of detail shows how that calculation would be performed at the Series level of detail in the view. The colors help demonstrate the level of detail in which the calculation is being performed.
| Series | Number of Books in Series - at Series level of detail |
| The Chronicles of Narnia | 7 |
| The Chronicles of Narnia | |
| The Chronicles of Narnia | |
| The Chronicles of Narnia | |
| The Chronicles of Narnia | |
| The Chronicles of Narnia | |
| The Chronicles of Narnia | |
| Sevenwaters | 6 |
| Sevenwaters | |
| Sevenwaters | |
| Sevenwaters | |
| Sevenwaters | |
| Sevenwaters |
In Tableau, the data looks like this:
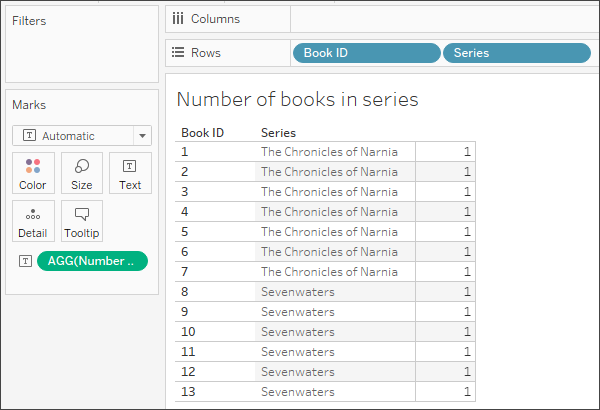
But if you drag in Book Id, (which is a more granular field), the calculation updates based on that new granularity since aggregate calculations are performed at the visualization level of detail.
Just like basic expressions , LOD expressions allow you to compute values at the data source level and the visualization level. However, LOD expressions give you even more control on the level of granularity you want to compute. They can be performed at a more granular level (INCLUDE), a less granular level (EXCLUDE), or an entirely independent level (FIXED).
For more information, see Create Level of Detail Expressions in Tableau(Link opens in a new window).
For example, consider the same sample table as above. If you wanted to compute when a book series was launched, you might use the following LOD expression:
{ FIXED [Series]:(MIN([Year Released]))}
The result can be seen below. The new column, titled Series Launched, displays the minimum year for each series. The colors help demonstrate the level of detail in which the calculation is being applied.
| Book ID | Book Name | Series | Year Released | Author | Series Launched |
| 1 | The Lion, the Witch and the Wardrobe | The Chronicles of Narnia | 1950 | C.S. Lewis | 1950 |
| 2 | Prince Caspian: The Return to Narnia | The Chronicles of Narnia | 1951 | C.S. Lewis | 1950 |
| 3 | The Voyage of the Dawn Treader | The Chronicles of Narnia | 1952 | C.S. Lewis | 1950 |
| 4 | The Silver Chair | The Chronicles of Narnia | 1953 | C.S. Lewis | 1950 |
| 5 | The Horse and His Boy | The Chronicles of Narnia | 1954 | C.S. Lewis | 1950 |
| 6 | The Magician's Nephew | The Chronicles of Narnia | 1955 | C.S. Lewis | 1950 |
| 7 | The Last Battle | The Chronicles of Narnia | 1956 | C.S. Lewis | 1950 |
| 8 | Daughter of the Forest | Sevenwaters | 1999 | Juliet Marillier | 1999 |
| 9 | Son of the Shadows | Sevenwaters | 2000 | Juliet Marillier | 1999 |
| 10 | Child of the Prophecy | Sevenwaters | 2001 | Juliet Marillier | 1999 |
| 11 | Heir of Sevenwaters | Sevenwaters | 2008 | Juliet Marillier | 1999 |
| 12 | Seer of Sevenwaters | Sevenwaters | 2010 | Juliet Marillier | 1999 |
| 13 | Flame of Sevenwaters | Sevenwaters | 2012 | Juliet Marillier | 1999 |
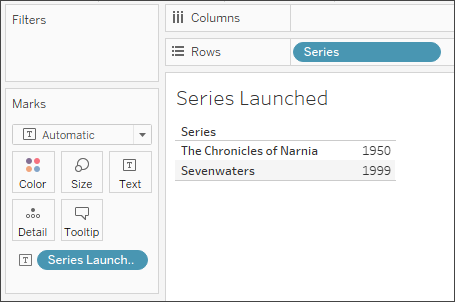
In Tableau, the calculation remains at the Series level of detail since it uses the FIXED function.
If you add another field to the view (which adds more granularity) the values for the calculation are not affected, unlike an aggregate calculation.
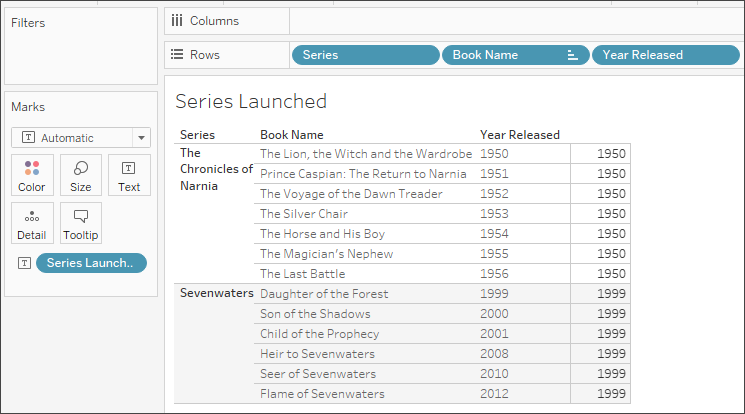
Table calculations allow you to transform values at the level of detail of the visualization only.
For more information, see Transform Values with Table Calculations(Link opens in a new window).
For example, consider the same sample table as above. If you wanted to compute the number of years since the author released their last book, you might use the following table calculation:
ATTR([Year Released]) - LOOKUP(ATTR([Year Released]), -1)
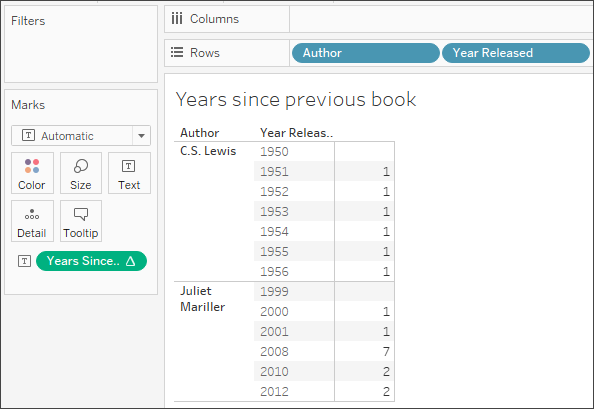
The result is shown below. The new column, titled Years Since Previous Book, displays the number of years between the book released in that row and the book released in the previous row (on the far right-side of the column) and demonstrates how the table calculation is being computed (on the left-side of the column).
The colors help demonstrate how the table calculation is being computed. In this case, the table calculation is being computed down each pane.
Note: Depending on the table calculation and how it is being computed across the table, the results may vary. For more information, see Transform Values with Table Calculations(Link opens in a new window).
| Book ID | Book Name | Series | Year Released | Author | Years Since Previous Book | ||
| 1 | The Lion, the Witch and the Wardrobe | The Chronicles of Narnia | 1950 | C.S. Lewis | NULL | ||
| 2 | Prince Caspian: The Return to Narnia | The Chronicles of Narnia | 1951 | C.S. Lewis | 1951- | 1950 | 1 |
| 3 | The Voyage of the Dawn Treader | The Chronicles of Narnia | 1952 | C.S. Lewis | 1952- | 1951 | 1 |
| 4 | The Silver Chair | The Chronicles of Narnia | 1953 | C.S. Lewis | 1953- | 1952 | 1 |
| 5 | The Horse and His Boy | The Chronicles of Narnia | 1954 | C.S. Lewis | 1954- | 1953 | 1 |
| 6 | The Magician's Nephew | The Chronicles of Narnia | 1955 | C.S. Lewis | 1955- | 1954 | 1 |
| 7 | The Last Battle | The Chronicles of Narnia | 1956 | C.S. Lewis | 1956- | 1955 | 1 |
| 8 | Daughter of the Forest | Sevenwaters | 1999 | Juliet Marillier | NULL | ||
| 9 | Son of the Shadows | Sevenwaters | 2000 | Juliet Marillier | 2000- | 1999 | 1 |
| 10 | Child of the Prophecy | Sevenwaters | 2001 | Juliet Marillier | 2001- | 2000 | 1 |
| 11 | Heir of Sevenwaters | Sevenwaters | 2008 | Juliet Marillier | 2008- | 2001 | 7 |
| 12 | Seer of Sevenwaters | Sevenwaters | 2010 | Juliet Marillier | 2010- | 2008 | 2 |
| 13 | Flame of Sevenwaters | Sevenwaters | 2012 | Juliet Marillier | 2012- | 2010 | 2 |
In Tableau, the data looks like this:
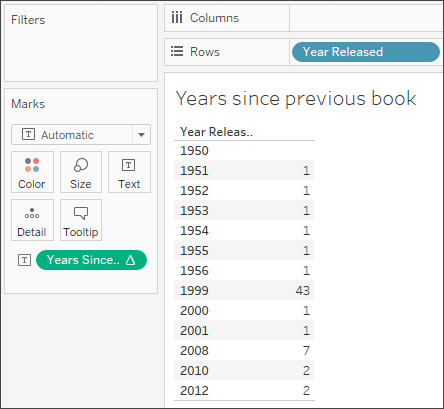
However, if you change the visualization in a way that affects the layout, such as removing a dimension from the view, the calculation values change.
For example, in the image below, Author is removed from the viz. Since the table calculation is computed by pane, removing Author changes the granularity and layout of the viz (instead of two panes there is now only one). The table calculation therefore calculates the time between 1956 and 1999.
Continue to Choosing the Right Calculation Type
See Also
Understanding Calculations in Tableau(Link opens in a new window)
Tips for Learning How to Create Calculations(Link opens in a new window)