Show Totals in a Visualization
This article demonstrates how to show grand totals and subtotals in a visualization, as well as how to customize how those totals are calculated and where they appear in the visualization.
To show grand totals in a visualization:
- Click the Analytics pane.
- In the Analytics pane, under Summarize, drag Totals into the Add Totals dialog, and drop it over either the Row Grand Totals or Column Grand Totals option.
Row grand totals appear automatically on the right-side of the visualization. Column grand totals appear automatically at the bottom of the visualization. For information how to move where totals appear, see Move totals.
In order to turn on grand totals:
- The view must have at least one header – Headers are displayed whenever you place a dimension on the Columns shelf or the Rows shelf. If column headers are displayed, you can calculate grand totals for columns. If row headers are displayed, you can calculate grand totals for rows.
- Measures must be aggregated – The aggregation determines the values displayed for the totals. See Grand totals and aggregations for more information.
- Grand totals cannot be applied to continuous dimensions.
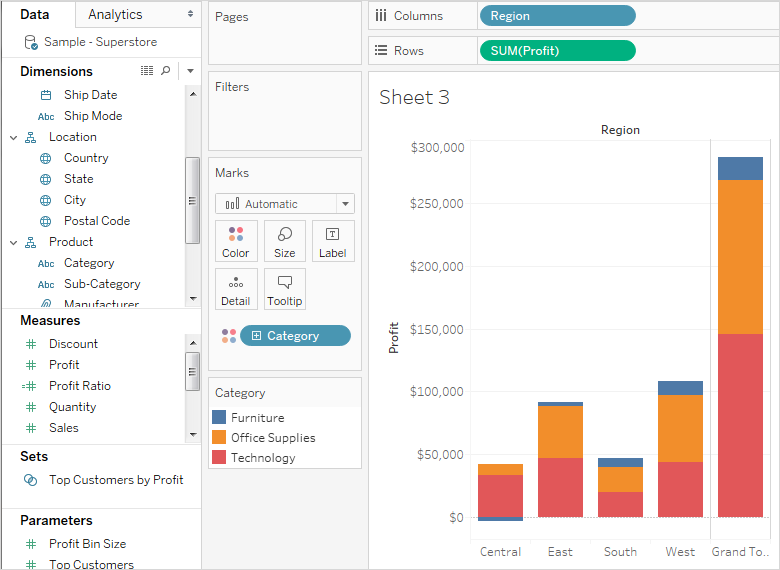
You can also display totals for graphical views of data. In the figure below, only column totals are calculated because the table contains only column headers.
Note: By default, totals are computed on the server if you are connected to a Microsoft Analysis Services data source, and locally if you are connected to an Essbase data source, using the aggregation specified in the cube. Refer to Configure total aggregation to learn more.
When you first turn on grand totals, the totals are computed using disaggregated data in the underlying data source. Consider the following view:
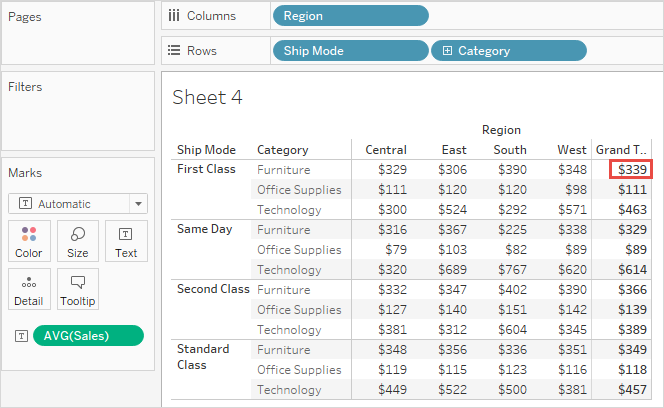
The average that you see at the right of the first row under Grand Total is $339. But if you compute the average for the four values you see in the row ($329, $306, $390, $348), the result comes to $343.25, not $339. The discrepancy is due to the fact that Tableau is averaging the data in the underlying data source. In this case there are more than four numbers to average, perhaps many more. The result is derived by averaging all values that have the properties Ship Mode = First Class, Category = Furniture, without regard to region.
To see totals that correspond to the numbers you see in your view requires two averaging operations in Tableau: first, values for the individual marks (or cells) in the view must be derived—for example, by averaging all values that have the properties Ship Mode = First Class, Category = Furniture, and Region = Central. Then the results for each region must be derived, by averaging the results for the individual marks. Fortunately, you do not need to perform two operations. To display a result of this type, from the Analysis menu choose Totals > Total All Using > Average . Now the average is performed on the values you see, and not on the disaggregated date in the data source:
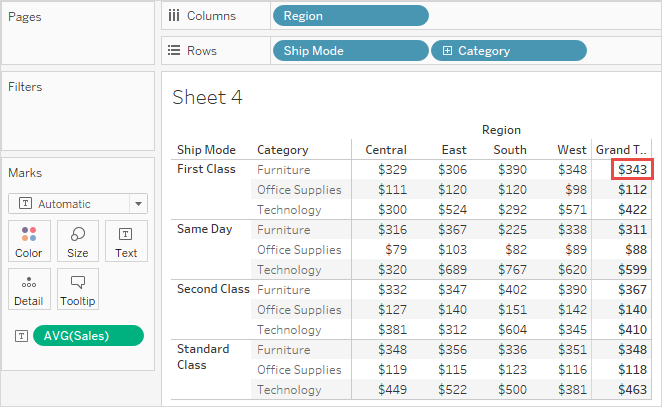
This kind of total is sometimes referred to as a two-pass total, because the average you see in the grand total column is aggregated twice--once to derive the column or row value, and then again across column or rows to derive the grand total.
When you turn on grand totals, the initial values are computing using the current aggregation for the fields in the view. In this case, totals are based on the underlying data rather than the data in the view.
For example, if you are totaling the SUM(Profit) for several products, the grand total will be the sum of the sums of profit. For aggregations such as SUM, you can easily verify the grand total because a summation of a group of sums is still a summation. However, be aware that your results may be unexpected when using other aggregations, especially custom aggregations. For details, See Configure total aggregation. You can verify any calculation such as an aggregation or a grand total by viewing the underlying disaggregated data.
The following table summarizes the standard aggregations and the grand totals that are calculated by default when, from the Analysis menu, Totals >Total All Using is set to the default value Automatic.
Note: Only Automatic totals are available for table calculations and fields from a secondary data source. Total aggregations cannot be applied to table calculations or fields from a secondary data source.
For more information, see Showing Grand Totals with Blended Data(Link opens in a new window) and Grand Totals and Subtotals Do Not Show Expected Numbers With Table Calculations(Link opens in a new window) in the Tableau Knowledge Base.
| Aggregation | Calculation Description |
|---|---|
| Sum | Shows the sum of the values shown in the row or column. |
| Average | Shows the average of the values shown in the row or column. |
| Median | Shows the median for the values shown in the row or column. |
| Count; Count Distinct | Shows how many values or distinct values are displayed in the rows and columns in the view. |
| Minimum | Shows the minimum value shown in the row or column. |
| Maximum | Shows the maximum value shown in the row or column. |
| Percentile | Shows the average percentile for all values shown in the row or column. |
| Standard Deviation | The grand total using standard deviation is the standard deviation of the values shown in the row or column. |
| Variance | The grand total using variance is not the variance of the rows and columns in which they reside but rather of the underlying data behind the row or column. |
To show subtotals in a visualization:
Click the Analytics pane.
In the Analytics pane, under Summarize, drag Totals into the Add Totals dialog, and drop it over Subtotals.
By default, row grand totals and subtotals appear on the right of the view, and column grand totals and subtotals appear at the bottom of the view.
In Tableau Desktop, you can also select to display totals on the left or top of the view.
To move row totals to the left of the view:
- Select Analysis > Totals, and then select Row Totals to Left.
To move column totals to the top of the view:
- Select Analysis > Totals, and then select Column Totals to Top.
When totals are turned on in the visualization (either grand totals, subtotals, or both), you can specify how totals should be computed. For example, you can choose to calculate totals using a sum, average, minimum, or maximum.
To configure all totals:
- Select Analysis > Totals > Total All Using, and then select an aggregation from the list.
To configure totals for a specific field:
- Right-click (Control-click on a Mac) a field in the view, select Total using, and then select an aggregation from the list.
When you choose Automatic, totals are based on the underlying data, which is disaggregated, and not on the data in the view. See Options for calculating grand totals. For details on how Tableau computes totals using the current aggregation, see Grand totals and aggregations.
When you choose any of the other values (Sum, Average, Minimum, or Maximum), all totals are computed using the selected aggregation. The computations are performed on the aggregated data you see in the view.
An additional value, Server, may be available. Server computation is not always available and sometimes the totals will be blank for specific members in the view. When using server computation keep in mind the following information:
- Server computation is only available for ASO cubes.
- Server computation is not available for dynamic hierarchies. This means that if the members in the view are part of a dimension or hierarchy that is tagged as dynamic, they cannot be included in the set of values you are using to compute the totals and will show up as blank in the view.
- If you are computing totals for a calculated field whose formula makes assumptions about other calculated members at different levels in the hierarchy, the totals will display as blank in the view.