Use Parameters to Make Views More Interactive
Parameters are useful when you want to add interactivity and flexibility to a report, or to experiment with what-if scenarios. Suppose you are unsure which fields to include in your view or which layout would work best for your viewers. You can incorporate parameters into your view to let viewers choose how they want to look at the data.
When you use parameters, you need to tie them to the view in some way:
- You can use parameters in calculations and calculated fields that are used in the view.
- You can display the parameter control in the view for users to select parameters.
- You can reference parameters in parameter actions.
Before you begin, decide which fields you want to make interactive. For example, you could allow users to view the categories within a dimension by color, or to view sales data over a period of time that they choose, and so on. The example described here sets up a table for which users can select the dimensions to display in the columns and rows.
Watch a video: For an in-depth presentation, watch Parameters | Oh, the places you'll go!(Link opens in a new window) (45 minutes).
Learn more: See Use Parameters to Add Multiple Views to Your Viz(Link opens in a new window) on the Tableau blog(Link opens in a new window) and multiple practical topics on how to use parameters on the Data School(Link opens in a new window) website.
Create the parameters
These steps use the Superstore sample to create new parameters.
In the Data pane, click the drop-down arrow in the upper right corner and select Create Parameter.
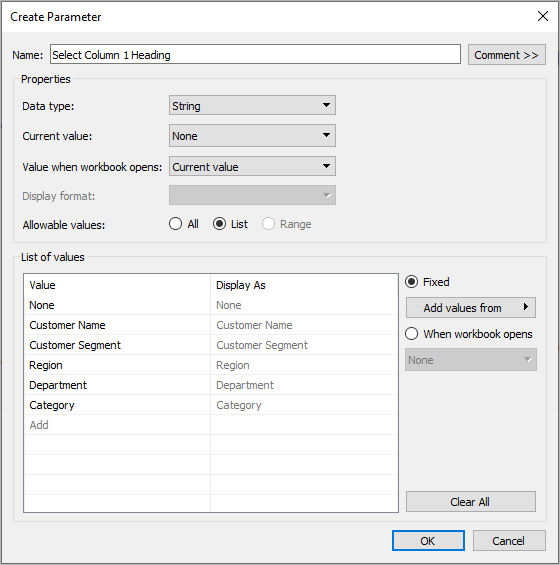
In the Create Parameter dialog box, complete the following steps:
Name the parameter so that viewers can tell what changing it will do. This example uses Select Column 1 Heading.
For Data type, select String.
For Allowable Values, select List, type None as the first value in the list, and then press Enter.
- Complete the list by typing the names of the additional dimension fields that you want to expose through the parameter.
Note: This example uses the customer name, customer segment, region, department, and category fields. These are all dimensions of the same data type (string). If you wanted to include a measure such as profit in this list, one option would be to convert the measure to a string value. You would do this when you build the calculated field, using the
STR()function. This article covers only the single data type scenario.The Display As aliases default to the field name, and for this exercise you can leave them as they are.
Click OK to return to the Calculated Field dialog box.
Repeat the previous step to create the following additional parameters:
- Select Column 2 Heading
- Select Row 1 Heading
- Select Row 2 Heading
Tip: Instead of typing each value in the list, click Add values from > Parameters to add them from Select Column 1 Heading.
Create the calculated fields
These steps use the Superstore sample to build the calculated fields that will take advantage of your parameters.
In the Data pane, click the drop-down arrow in the upper right corner and select Create Calculated Field.
- In the Calculated Field dialog box, for Name, type Column 1 Category.
In the Calculated Field dialog box, for Formula, build the following calculation:
CASE [Select Column 1 Heading]

WHEN 'Customer Name' THEN [Customer Name]

WHEN 'Customer Segment' THEN [Customer Segment]

WHEN 'Region' THEN [Region]

WHEN 'Department' THEN [Department]

WHEN 'Category' THEN [Category]

ELSE ''

END
Confirm that the status message indicates that the formula is valid, and then click OK.
Note: ELSE accounts for the None value that you included in the parameter, and it returns an empty string.
Create three more calculated fields, one for each of the additional parameters you created:
Parameter name Calculated field name Select Column 2 Heading Column 2 Category Select Row 1 Heading Row 1 Category Select Row 2 Heading Row 2 Category The basic formula for each calculated field is the same as in the previous step, except that you reference a different parameter in each
CASEstatement.
Give viewers a way to interact with views
Next, expose the parameter control so users can select the categories they want to display.
For each parameter you created, do the following:
Under Parameters, right-click the parameter and select Show Parameter Control.

From the Data pane, drag the calculated fields you created to the Columns and Rows shelves.
From the Data pane, drag a measure to the view. In this example, Sales is placed on Label on the Marks card.
Test your parameters by selecting fields in the parameter controls.
Tips:
- Sort the dynamic dimension fields alphabetically.
- Hide field labels for rows and columns.

Reset all parameters to None and publish the workbook to Tableau Server.

Viewers can set up their own reports, save their parameter settings, and share views with others.
Additional information
For information about building views dynamically, see Swap Measures Using Parameters(Link opens in a new window).
For information about the different areas in the Tableau interface in which you can create and incorporate parameters, see Create Parameters and its related topics in the Tableau Help.
Disclaimer: This topic includes information about parameters from a third-party blog, The Information Lab: Data School. Please note that while we make every effort to keep references to third-party content accurate, the information we provide here might change without notice as content on their website changes.