Plan the Data Source
At the center of Tableau is your data. How successful you are with exploring data, answering questions, and building visualizations for yourself or others to consume all depend on the underlying data.
If your goal is to do some quick exploration or ad-hoc analysis, you might be able to hop in, connect to some data, drag and drop a bit to build some vizzes, and hop out with the information you need. But if your goal is to create an analysis or data source that will be used more than once, it's best to think through and plan your data source.
Tableau data sources
A Tableau data source is the link between your source data and Tableau. It is essentially the sum of your data (either as a live connection or an extract), the connection information, the names of tables or sheets containing data, and the customizations that you make on top of data to work with it in Tableau. Those customizations include things like how the data is combined and metadata such as calculations, renamed fields, and default formatting.
A Tableau data source may contain multiple data connections to different databases or files. Connection information includes where the data is located, such as a file name and path or a network location, and details on how to connect to your data, such as database server name and server sign-in information.
Note: The terms data source and data connection have been used indiscriminately in the past and may lack clear distinction in older materials.
It’s also important to bear in mind the difference between the Tableau data source (Tableau’s access to your data and all the customizations that may be involved) and the source data itself (such as a database or Excel spreadsheet). Planning a data source in the sense of designing a database is not the scope of this topic.
Tableau data sources can remain embedded in the workbook where they were originally created, or they can be published separately. Published Data Sources allow for centralization and scaling of curated data sources. See Best Practices for Published Data Sources for more information.
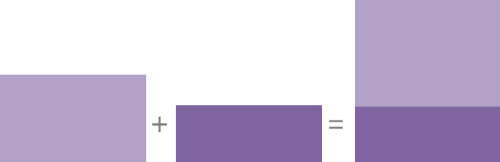
If your data comes from one table, you can connect to your data to create the data source, drag the table onto the canvas, and then start building your view. But if your data is spread across multiple tables—or across multiple databases—you’ll need to combine it. Combining data happens on the Data Source Page.
| Single database | Multiple databases |
|
|
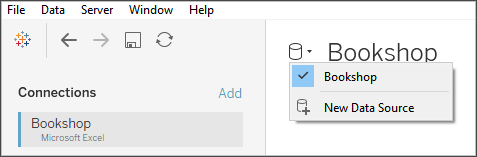
Note: In order to relate tables across different databases, they must be added as data connections within the same data source, not a new data source. Data connections are added from the Add link in the Left pane. New data sources can be created from the Data menu or the drop down menu from the icon next to the Data Source’s name, as seen in the image below.
Methods of combining data
Relationships are the default way to combine data in Tableau. Relationships are a dynamic, flexible way to combine data from multiple tables for analysis. If necessary, tables can also be joined or unioned. Data sources can also be blended. Let’s take a look the options for how data can be combined in Tableau and some of the situations when each method is useful.
| Relationships |
Establish the potential for joins between two tables based on related fields. Does not merge data together to create a new, fixed table. During analysis, queries the relevant tables automatically using the contextually-appropriate joins to generate a custom table of data for that analysis.
Maintains the appropriate level of detail, does not lose data, keeps appropriate aggregations, and handles nulls. |
| Joins |
Merge two tables of data based on a join clause and join type to form a new, fixed table of data. Often used to add new columns of data across the same basic row structure.
May cause data loss with some join types if fields are not present in all tables. May cause data duplication if tables are at different levels of detail. |
| Unions | Merge two or more tables of data to form a new, fixed table of data. Used to append (add new rows of) data across the same basic column structure. |
| Blends | Work across two or more separate Tableau data sources. Data remains separate. Tableau queries the data sources independently and visualizes the results together in the view, based on the linking fields established for that sheet. Mimics the behavior of a left join and may filter data from secondary data sources. |
Note: It’s also possible to combine data with Custom SQL. Most of the time, it’s best to combine data directly in the canvas or with data blending. This allows Tableau the greatest flexibility for optimization. However, in certain scenarios, there may be reasons to use Custom SQL. Keep in mind doing so can have performance implications because Tableau is forced to execute the Custom SQL statement as written.
Relationships
Relating is a method for working with data from multiple tables based on shared fields—columns—between those tables. Establishing a relationship informs Tableau how rows can be connected across tables. Tableau holds that information but does not immediately bring the rows together as happens with a hard coded join. Instead, when a visualization is created, the fields involved in the analysis are traced back through the relationship and the appropriate joins are created to return the correct data.
Because the data is never forced into a single table outside the context of a visualization, relationships are useful when the data is at different levels of detail, or granularity. For example, if you need to work with data about daily rainfall in one table but hourly temperatures in another.
For more information about how to combine tables using relationships, see Relate Your Data
For more information about how to combine tables using relationships, see Relate Your Data and these Tableau blog posts:
- Relationships, part 1: Introducing new data modeling in Tableau(Link opens in a new window)
- Relationships, part 2: Tips and tricks(Link opens in a new window)
- Relationships, part 3: Asking questions across multiple related tables(Link opens in a new window)
Note: In Tableau version 2024.2 and later, the Tableau data model supports multi-fact analysis and shared dimensions through multi-fact relationships. For more information, see About Multi-fact Relationship Data Models(Link opens in a new window), When to Use a Multi-fact Relationship Model(Link opens in a new window), and Build a Multi-fact Relationship Data Model(Link opens in a new window).
Join
Joining is a method for combining tables related by common fields. The result of combining data using a join is a table that extends horizontally by adding columns of data.

For more information about how to join data in Tableau, see Join Your Data.
Data blending
When you use data blending to combine your data, you combine data in what is called a primary data source with common fields from one or more secondary data sources.
Data blending is useful when you need to change how the data source is configured on a sheet-by-sheet basis, when you want to combine databases that don’t allow relationships or joins such as cube data sources or Published Data Sources.
The result of combining data using data blending is a virtual table that extends horizontally by adding columns of data. The data from each data source will be aggregated to a common level before being displayed together in the visualization.

For more information about how data blending works and how to blend your data in Tableau, see Blend Your Data.
Union
Unioning is a method for appending values (rows) to tables. You can union tables if they have the same columns. The result of combining data using a union is a virtual table that has the same columns but extends vertically by adding rows of data.
You can union tables in one of two ways: manually or using wildcard search. For more information about how to union data using one of these methods in Tableau, see Union Your Data.
Considerations for a Tableau data source
Before anything else, make sure you’re clear on the purpose of the data source. If you’re creating a catch-all data source for a wide variety of users with broad questions, you’d go about it differently than if you were constructing a niche data source optimized for performance. It’s important to know your goal from the outset.
With that goal in mind, there are several items to consider and plan before you build a data source in Tableau:
- Location and access
- Shape and cleanliness
- The data model and combining data
- Metadata and customization
- Scalability, security, and discoverability
- Performance and freshness
Location and access
The location of your data can be as simple as a single Excel file on your computer or a Google sheet you’ve created, or as complex as multiple databases using various technologies. Access can also involve specific drivers or connectors for a database or login information for a database server.
Questions to consider:
- Do the correct Tableau users have access and permissions to the data and to Tableau?
- What user account should be used to log into the database?
- Will user filtering or row level security be needed?
- Is the source data on premises or in the cloud?
- This may have implications if the data is published to Tableau Cloud.
- Are there Supported Connectors?
- Are there any limitations for that database (does it support all the functionality you hope to use)?
Shape and cleanliness
Your organization may already have well-structured data that you can connect to or ETL processes you can leverage, or you may need to use Tableau Prep Builder to perform cleaning and shaping operations to get your data into a useful format.
Questions to consider:
- Is the data well-structured for use with Tableau?
- Should Tableau Prep Builder and Tableau Prep Conductor be used to clean and automate data prep flows?
- What calculations or manipulations would be best done natively in Tableau?
- Is any of this data unnecessary? Is any data missing?
The data model and combining data
Tableau needs to know how to query the data, which is conveyed by The Tableau Data Model. If the data comes from multiple tables, the data needs to be combined. Methods for combining data include relationships, joins, unions, and blends.
Questions to consider:
- Is the data spread across multiple systems?
- What is the best way to combine each table of data?
Metadata and customization
Data is often stored in a way that isn’t easy for a person to use comfortably. For example, default field names can be unwieldy, custom formatting may be desired, definitions of abbreviations or codes may be missing, or common calculations may not be present in the underlying data. Creating a semantic layer with those pieces of information can make the data much easier to understand and use.
Questions to consider:
- What calculations should be added?
- Are the table and field names understandable?
- Are the default settings for the fields useful or should they be customized?
- Are there any adjustments that should be made to support Tableau Catalog?
Note that Explain Data does not support multi-table data sources at this time.
Scalability, security, and discoverability
A data source may remain in the workbook where it was created—an embedded data source—or it may be published to Tableau Server or Tableau Cloud independently of any analysis as a content asset all its own. This centralization of published data sources has the added benefit of security and scaling, allowing multiple users to access a consistent data source. Published data sources can also take advantage of Tableau Catalog and recommendations and provide a single source of truth for an organization.
Questions to consider:
- Should the data source stay embedded in the workbook?
(The following questions assume the data source is published)
- Where will the data source be published?
- Who will own the data source?
- What authentication and permissions should it have?
- Will it be certified?
Performance and freshness
In addition, Tableau data sources can be live connections to the source data or the data can be copied out as a refreshable extract. Extracts can boost the analysis performance or prevent resource drains against database systems.
Questions to consider:
- Should the data connection be live or an extract?
- If extracted, will there be a refresh schedule? (Tableau Server | Tableau Cloud)
- If published to Tableau Cloud, will Tableau Bridge need to be used?
Build quality data sources
There’s a lot that goes into a well-designed and performant data source. You don’t have to publish your first attempt, though. Like creating a good visualization, building a data source can be an ongoing process. Try your hand at combining the data you think you need and then see if you can build the viz you want. You can always go back and write a new calculation or bring in another table of data. Do some user testing and ask a colleague if they can figure out your field names.
Of course, it’s best to only publish data sources you’re confident in and only certify ones that have passed quality assurance. By the time your data source is in front of users, they should be able to trust it.