Tableau's Order of Operations
The order of operations in Tableau, sometimes called the query pipeline, is the order in which Tableau performs various actions. Actions are also known as operations. Many operations apply filters, which means that as you build a view and add filters, those filters always execute in the order established by the order of operations.
Watch a Video: To see related concepts demonstrated in Tableau, watch Understanding Tableau's Order of Operations(Link opens in a new window), a 1-hour, free video presentation.
This article includes two scenarios for updating a view to correct problems resulting from the order of operations: converting a dimension filter to a context filter, and converting a table calculation to a FIXED level of detail expression.
Sometimes, you might expect Tableau to execute filters in one order, but the order of operations dictates that they be executed in a different order, which gives you unexpected results. When this happens, you can sometimes change the order in which operations are executed in the pipeline.
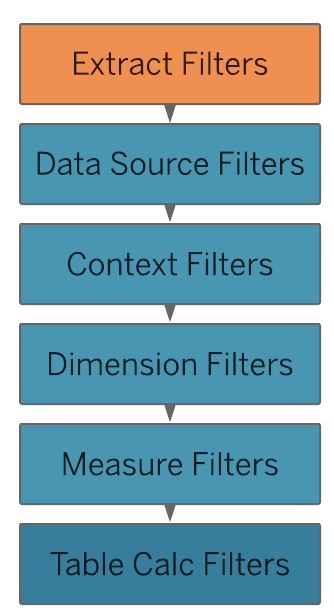
The Tableau order of operations includes the following, from top to bottom.
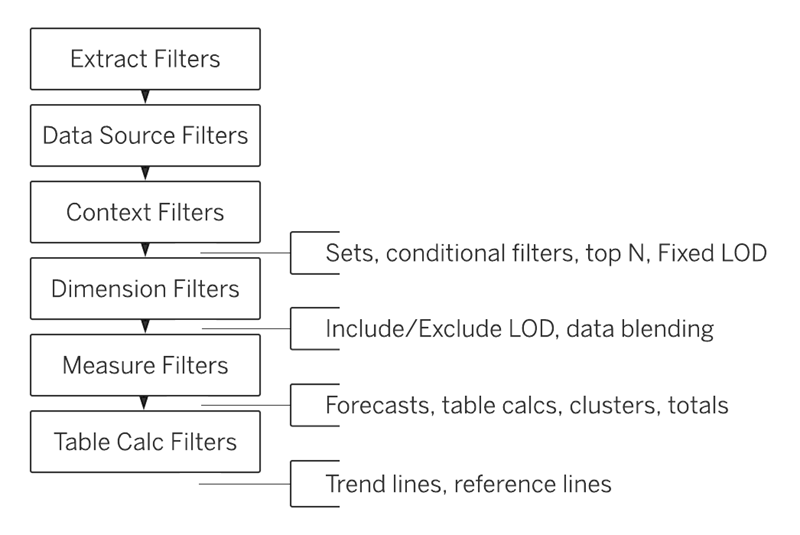
Note: In the order of operations, the latest date filter is global to the workbook, while context filters apply per worksheet. The latest date is determined just after the workbook opens for first use, after data source filters, but before context filters. At that point the date is set, and the latest date preset is used as a dimension filter.
This and the following example use the Sample – Superstore data source provided with Tableau Desktop.
In this example, the view addresses the following question: Who are the top 10 customers, by total sales, in New York City?
The view contains two dimension filters, one that you create on the General tab in the Filters dialog box, and the other on the Top N tab. The problem is that these filters are executing simultaneously, whereas you would like to general filter to be applied before the top n filter, so that the top n filter can act on the results as previously filtered by the general filter. The solution is to redefine one of the filters as a context filter so that a clear order of precedence is established.
Here are the steps for building this view.
Drag Sales to Columns.
Drag City and [Customer Name] to Rows.
Drag City from the Data pane again, this time to Filters. On the General tab in the Filter dialog box, set the filter to show just a single value: New York City. Do this by clicking None and then choosing New York City.
This creates a general dimension filter.
Click the Sort Descending button (
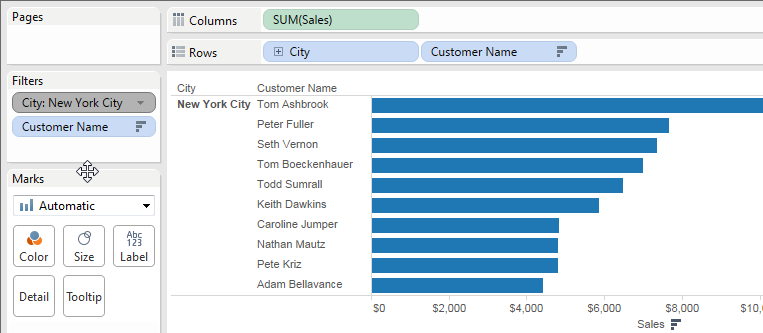
 ) on the toolbar. Your view now looks like this:
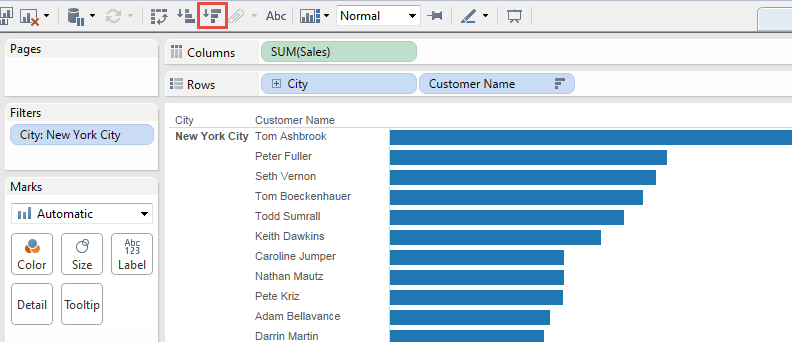
Note the first few names in the list: Ashbrook, Fuller, Vernon, etc.
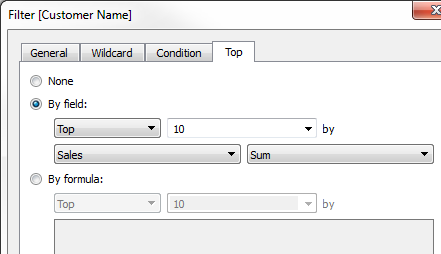
Now drag [Customer Name] from the Data pane to Filters, and create a Top 10 Filter, to show only the top 10 customers by total sales:
After you apply this second filter, the view looks right, but notice that the names shown are no longer the same as before:
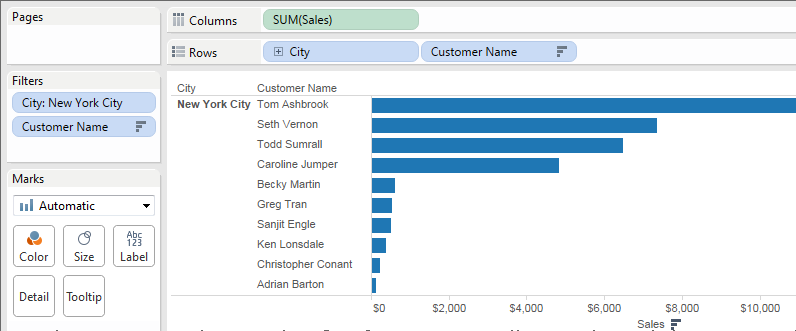
What happened to Peter Fuller, formerly in second place? The goal was to show the top 10 customers in New York City, but now the view is actually showing the top 10 customers overall.
The problem is that top and general dimension filters are applied simultaneously—they are both dimension filters, and they appear in the same place in the Tableau order of operations:
The solution is to add the general dimension filter (on City) to context—that is, by turning it into a context filter, which is executed before any other filter that you create in a worksheet.
For details, see Use Context Filters.
Right-click City on the Filters shelf (Control-click on a Mac) and choose Add to Context. As a context filter, this filter now takes precedence over the dimension filter, and so the view now shows what it’s supposed to:
In this example, the view addresses the following question: What is the percent of total sales by product sub-category?
The view contains a dimension filter and a table calculation. Tableau applies the dimension filter before executing the table calculation. To invert the order of these operations, use a FIXED level of detail expression instead of a table calculation.
Here are the steps for building this view.
In a new worksheet, drag Sales to Columns.
Drag Sub-Category to Rows.
Right-click SUM(Sales) on Columns and select a quick table calculation – Percent of Total.
Click the Sort Descending button (
) on the toolbar to sort the categories from most to least.Click the Show Mark Labels button (
 ) on the toolbar to display measure values in the view.
Your view now looks like this:
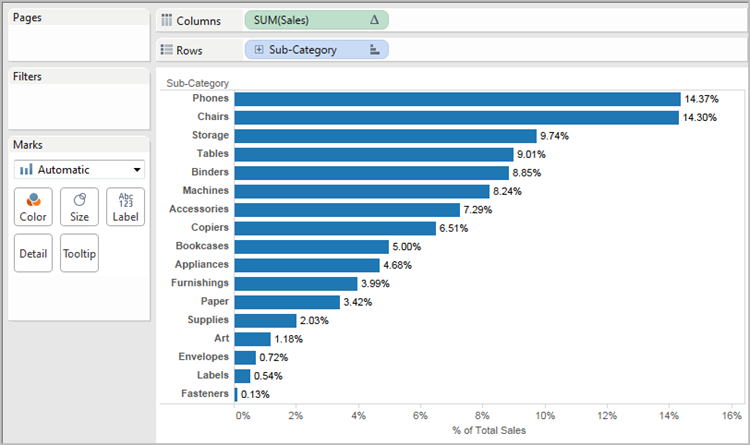
Note the percentages for the first few items: 14.37%, 14.30%, etc.
Right-click Sub-Category on Rows and choose Show Filter.
Clear the check mark for Chairs in the filter.
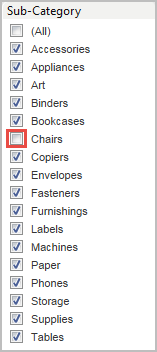
In the view, the percentages are now different—the highest percentage is now over 16%. In some cases, this may be just the result that you want (that is, for percentages to be recalculated as you work with the quick filter). But in other cases you may want the percentages to hold steady even as you filter items in or out. That’s what we want in this case.
In the order of operations, a dimension filter is applied before a table calculation:
To have Tableau calculate the percentages before it acts on the quick filter, you create a FIXED level of detail expression, and then use that instead of the table calculation.
FIXED level of detail expressions compute a value using the specified dimensions, without reference to the dimensions in the view. In this case you’ll use it to establish percentages for the various sub-categories—percentages that won’t be affected by your general dimension filter. Why? Because FIXED level of detail expressions are computed before dimension filters are applied.
For details, see Create Level of Detail Expressions in Tableau.
The FIXED level of detail expression must divide the sum of Sales (for a particular measure value) by the total sum of Sales for the view. Because the numerator is aggregated, the denominator must be as well, so the expression you write is:
SUM([Sales])/SUM({FIXED : SUM([Sales])})Save that expression as FixedSumOfSales and then drag it from the Data pane to Columns, dropping it to the right of the existing SUM(Sales) field that uses the table calculation. (Keep them both in the view for comparison.) Here is what your view now looks like:
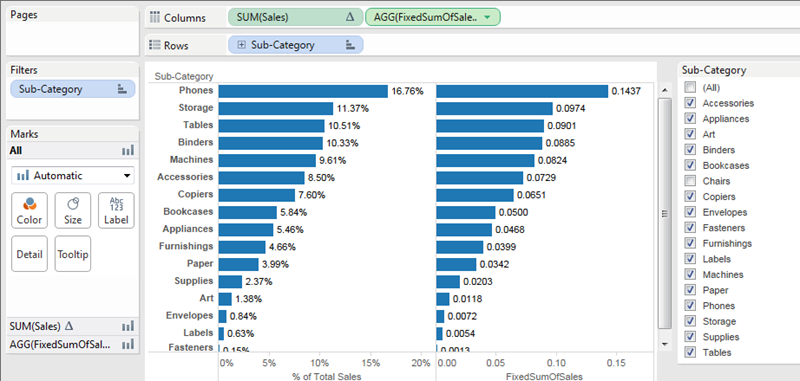
The percentage numbers in the chart on the right are now consistent, regardless of which fields you select or don’t select with the quick filter. All that remains is to format the values for FixedSumOfSales so that they show as percentages.
Right-click FixedSumOfSales on Columns and choose Format. In the Format pane, choose Numbers and then Percentage:
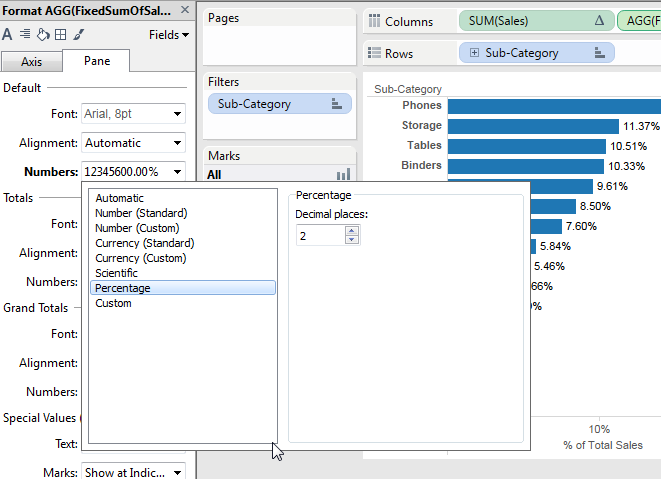
This gives you the final view:

As you select or clear items in the Sub-Category quick filter, the percentages in the bar chart on the left change, but the percentages in the bar chart on the right do not.