Aggregate Functions in Tableau
This article introduces aggregate functions and their uses in Tableau. It also demonstrates how to create an aggregate calculation using an example.
Aggregate functions allow you to summarize or change the granularity of your data.
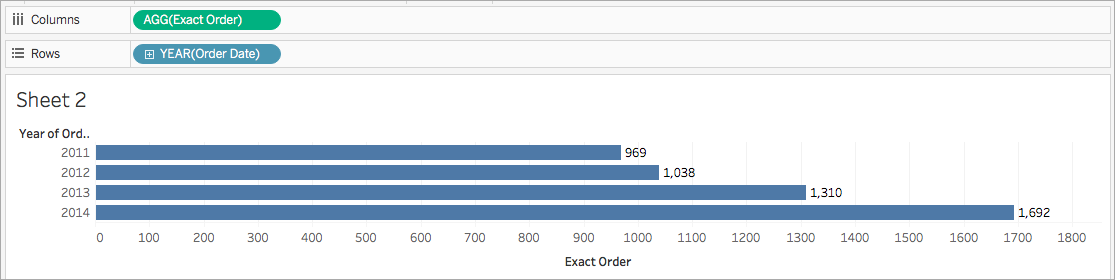
For example, you might want to know exactly how many orders your store had for a particular year. You can use the COUNTD function to tally the exact number of unique orders your company had, and then break the visualization down by year.
The calculation might look something like this:
COUNTD(Order ID)
The visualization might look something like this:
Aggregations and floating-point arithmetic: The results of some aggregations may not always be exactly as expected. For example, you may find that the SUM function returns a value such as -1.42e-14 for a column of numbers that you know should sum to exactly 0. This happens because the Institute of Electrical and Electronics Engineers (IEEE) 754 floating-point standard requires that numbers be stored in binary format, which means that numbers are sometimes rounded at extremely fine levels of precision. You can eliminate this potential distraction by using the ROUND function (see Number Functions) or by formatting the number to show fewer decimal places.
ATTR
| Syntax | ATTR(expression) |
| Definition | Returns the value of the expression if it has a single value for all rows. Otherwise returns an asterisk. Null values are ignored. |
AVG
| Syntax | AVG(expression) |
| Definition | Returns the average of all the values in the expression. Null values are ignored. |
| Notes | AVG can only be used with numeric fields. |
COLLECT
| Syntax | COLLECT(spatial) |
| Definition | An aggregate calculation that combines the values in the argument field. Null values are ignored. |
| Notes | COLLECT can only be used with spatial fields. |
CORR
| Syntax | CORR(expression1, expression2) |
| Output | Number from -1 to 1 |
| Definition | Returns the Pearson correlation coefficient of two expressions. |
| Example | example |
| Notes | The Pearson correlation measures the linear relationship between two variables. Results range from -1 to +1 inclusive, where 1 denotes an exact positive linear relationship, 0 denotes no linear relationship between the variance, and −1 is an exact negative relationship. The square of a CORR result is equivalent to the R-Squared value for a linear trend line model. See Trend Line Model Terms(Link opens in a new window). Use with table scoped LOD expressions: You can use CORR to visualize correlation in a disaggregated scatter using a table-scoped level of detail expression(Link opens in a new window). For example: {CORR(Sales, Profit)} With a level of detail expression, the correlation is run over all rows. If you used a formula like |
| Database limitations |
For other data sources, consider either extracting the data or using |
COUNT
| Syntax | COUNT(expression) |
| Definition | Returns the number of items. Null values are not counted. |
COUNTD
| Syntax | COUNTD(expression) |
| Definition | Returns the number of distinct items in a group. Null values are not counted. |
COVAR
| Syntax | COVAR(expression1, expression2) |
| Definition | Returns the sample covariance of two expressions. |
| Notes | Covariance quantifies how two variables change together. A positive covariance indicates that the variables tend to move in the same direction, as when larger values of one variable tend to correspond to larger values of the other variable, on average. Sample covariance uses the number of non-null data points n - 1 to normalize the covariance calculation, rather than n, which is used by the population covariance (available with the If The value of |
| Database limitations |
For other data sources, consider either extracting the data or using |
COVARP
| Syntax | COVARP(expression 1, expression2) |
| Definition | Returns the population covariance of two expressions. |
| Notes | Covariance quantifies how two variables change together. A positive covariance indicates that the variables tend to move in the same direction, as when larger values of one variable tend to correspond to larger values of the other variable, on average. Population covariance is sample covariance multiplied by (n-1)/n, where n is the total number of non-null data points. Population covariance is the appropriate choice when there is data available for all items of interest as opposed to when there is only a random subset of items, in which case sample covariance (with the If |
| Database limitations |
For other data sources, consider either extracting the data or using |
| Syntax | MAX(expression) or MAX(expr1, expr2) |
| Output | Same data type as the argument, or NULL if any part of the argument is null. |
| Definition | Returns the maximum of the two arguments, which must be of the same data type.
|
| Example | MAX(4,7) = 7 |
| Notes | For strings
For database data sources, the For dates For dates, the As an aggregation
As a comparison
See also |
MEDIAN
| Syntax | MEDIAN(expression) |
| Definition | Returns the median of an expression across all records. Null values are ignored. |
| Notes | MEDIAN can only be used with numeric fields. |
| Database limitations |
For other data source types, you can extract your data into an extract file to use this function. See Extract Your Data(Link opens in a new window). |
| Syntax | MIN(expression) or MIN(expr1, expr2) |
| Output | Same data type as the argument, or NULL if any part of the argument is null. |
| Definition | Returns the minimum of the two arguments, which must be of the same data type.
|
| Example | MIN(4,7) = 4 |
| Notes | For strings
For database data sources, the For dates For dates, the As an aggregation
As a comparison
See also |
PERCENTILE
| Syntax | PERCENTILE(expression, number) |
| Definition | Returns the percentile value from the given expression corresponding to the specified <number>. The <number> must be between 0 and 1 (inclusive) and must be a numeric constant. |
| Example | PERCENTILE([Score], 0.9) |
| Database limitations | This function is available for the following data sources: Non-legacy Microsoft Excel and Text File connections, Extracts and extract-only data source types (for example, Google Analytics, OData, or Salesforce), Sybase IQ 15.1 and later data sources, Oracle 10 and later data sources, Cloudera Hive and Hortonworks Hadoop Hive data sources, EXASolution 4.2 and later data sources. For other data source types, you can extract your data into an extract file to use this function. See Extract Your Data(Link opens in a new window). |
STDEV
| Syntax | STDEV(expression) |
| Definition | Returns the statistical standard deviation of all values in the given expression based on a sample of the population. |
STDEVP
| Syntax | STDEVP(expression) |
| Definition | Returns the statistical standard deviation of all values in the given expression based on a biased population. |
SUM
| Syntax | SUM(expression) |
| Definition | Returns the sum of all values in the expression. Null values are ignored. |
| Notes | SUM can only be used with numeric fields. |
VAR
| Syntax | VAR(expression) |
| Definition | Returns the statistical variance of all values in the given expression based on a sample of the population. |
VARP
| Syntax | VARP(expression) |
| Definition | Returns the statistical variance of all values in the given expression on the entire population. |
Follow along with the steps below to learn how to create an aggregate calculation.
- In Tableau Desktop, connect to the Sample - Superstore saved data source, which comes with Tableau.
- Navigate to a worksheet and select Analysis > Create Calculated Field.
- In the calculation editor that opens, do the following:
- Name the calculated field Margin.
- Enter the following formula:
IIF(SUM([Sales]) !=0, SUM([Profit])/SUM([Sales]), 0)Note: You can use the function reference to find and add aggregate functions and other functions (like the logical IIF function in this example) to the calculation formula. For more information, see Use the functions reference in the calculation editor.
- When finished, click OK.
The new aggregate calculation appears under Measures in the Data pane. Just like your other fields, you can use it in one or more visualizations.
Note: Aggregation calculations are always measures.
When Margin is placed on a shelf or card in the worksheet, its name is changed to AGG(Margin), which indicates that it is an aggregate calculation and cannot be aggregated any further.
The rules that apply to aggregate calculations are as follows:
- For any aggregate calculation, you cannot combine an aggregated value and a disaggregated value. For example,
SUM(Price)*[Items]is not a valid expression because SUM(Price) is aggregated and Items is not. However,SUM(Price*Items)andSUM(Price)*SUM(Items)are both valid. - Constant terms in an expression act as aggregated or disaggregated values as appropriate. For example:
SUM(Price*7)andSUM(Price)*7are both valid expressions. - All of the functions can be evaluated on aggregated values. However, the arguments to any given function must either all be aggregated or all disaggregated. For example:
MAX(SUM(Sales),Profit)is not a valid expression because Sales is aggregated and Profit is not. However,MAX(SUM(Sales),SUM(Profit))is a valid expression. - The result of an aggregate calculation is always a measure. This includes expressions like ATTR(Dimension) or MIN(Dimension).
- Like predefined aggregations, aggregate calculations are computed correctly for grand totals. Refer to Grand Totals for more information.
See also
Understanding Calculations: Aggregate Calculations(Link opens in a new window)
Data Aggregation in Tableau(Link opens in a new window)