Measure Values and Measure Names
The Data pane always contains a number of fields that do not come from your original data, two of which are Measure Values and Measure Names. Tableau automatically creates these fields so that you can build certain types of views that involve multiple measures.
The Measure Values field contains all the measures in your data, collected into a single field with continuous values. Drag individual measure fields out of the Measure Values card to remove them from the view.
The Measure Names field contains the names of all measures in your data, collected into a single field with discrete values.
Tableau automatically creates these fields so that you can build certain types of views that involve multiple measures.
Measure Values and Measure Names are in most respects like other fields in Tableau:
You can display a filter for Measure Names.
You can format Measure Values—the formatting is then inherited as the default formatting for all measures.
You can drop Measure Values and Measure Names on shelves.
You can assign aliases to the values for Measure Names.
You can change the manual sort order for the values for Measure Names.
When Measure Values is in the view, Tableau creates a Measure Values card, outlined in red, below, that lists the measures in the data source with their default aggregations.

You can remove individual measures from the view by dragging them out of the Measure Values card.
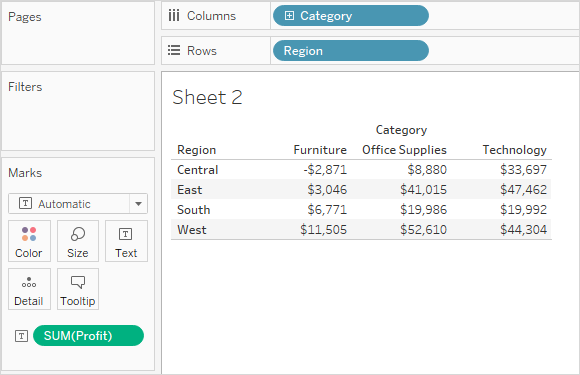
When you want to show multiple measures in a view, you can use the Measure Values and the Measure Names fields. When you add Measure Names to a view, all of the measure names appear as row or column headers in the view. The headers include each measure name. This feature becomes useful when you are working with a text table that shows multiple measures. For example, suppose you have a text table containing the aggregated profit of each product category by region.
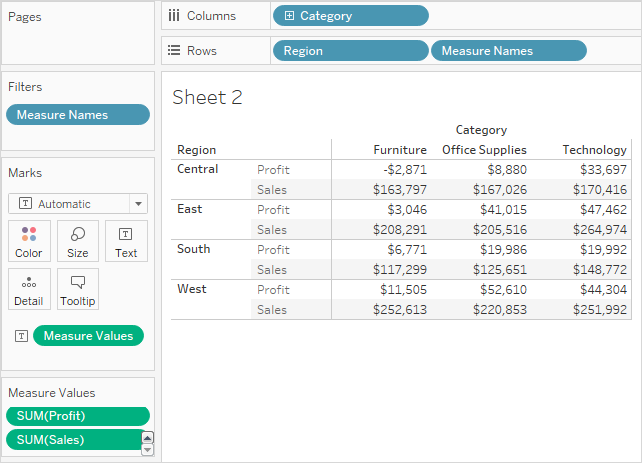
Now suppose you want to show both the Profit and the Sales for each category and region. When you add Sales to the text table (by dragging it and dropping it in the view), the measures are combined and the Measure Values field is added to Text. The Measure Names field is automatically added to the Rows shelf.
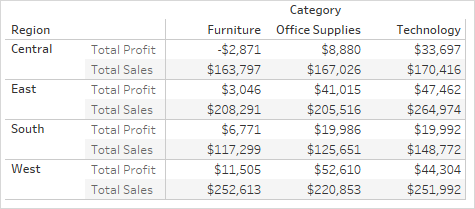
Notice how the header names removed the aggregation label by default. You may want to include the aggregations or call it "Total Profit" and "Total Sales." To change the measure names, right-click (control-click on Mac) the Measure Names field on the Rows shelf and select Edit Aliases. Make the changes and click OK.
You can use Measure Values and Measure Names to display the values for all measures in you data source, using their default aggregations, simultaneously. The view below was created with the Sample - Superstore data source. It shows the values of all measures in the Data pane, using their default aggregations.
To create this view
Create a new worksheet using the Superstore example workbook.
Drag Measure Values to Rows
Click Text Table in Show Me.
Text Table from Show Me.
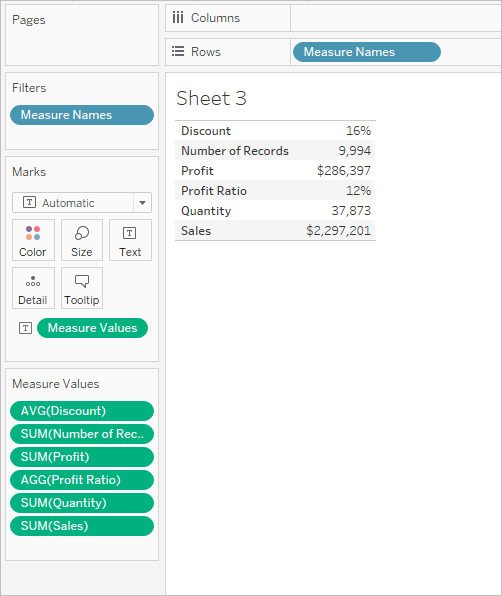
Of course, this view is not well suited for any more than a quick survey of your data because you can't generate a great deal of insight by comparing numbers that aren't measuring the same thing—Profit and Sales are both in dollars, but Discount and Profit Ratio are percentages.
Tableau will automatically add Measure Names and Measure Values fields to the view in response to certain actions on your part.
Blending Axes
You can show multiple measures on the same continuous axis by blending axes. For details, see Blend axes for multiple measures into a single axis. When you use this technique, Tableau automatically adds Measure Names and Measure Values to the view, allowing you add additional measures to the blended axis.
Using Show Me When Multiple Measures Are in the View
When there are multiple measures in the view, Tableau will automatically add Measure Names and Measure Values—or just Measure Names—when you choose certain visualization types from Show Me.
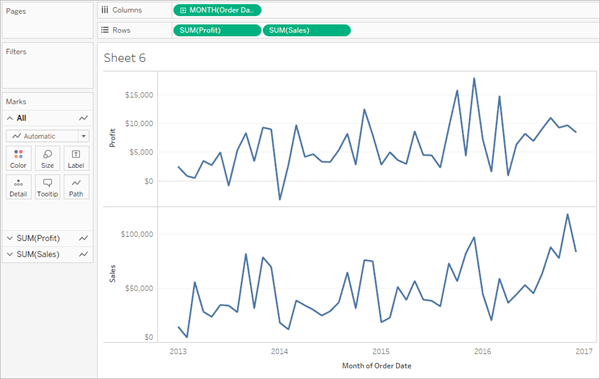
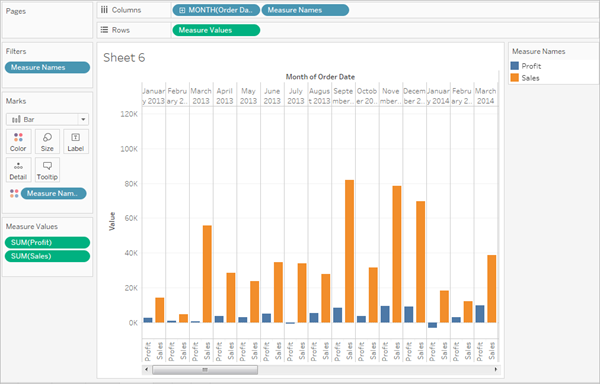
When you choose side-by-side bars when there are multiple measures in the view, Tableau adds both Measure Values and Measure Names. For example, your original view might use lines to show Sales and Profit over time:
If you choose side-by-side lines from Show Me, the view updates to include Measure Names and Measure Values:
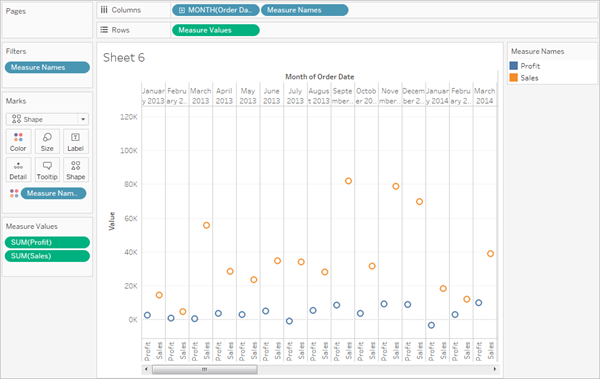
When you choose side-by-side circles from Show Me when there are multiple measures in the view, Tableau adds Measure Values and Measure Names:
When you choose dual lines from Show Me when there are multiple measures in the view, Tableau adds Measure Names but not Measure Values:

This is similar to blending axes, except that Tableau uses separate value ranges (one on the left of the view and one on the right) to make the lines align as closely as possible. With blended axes, Tableau uses a single value range and the lines may or may not align well.
When Measure Values and Measure Names are in the view, you can color code data for each individual measure. For details, see Measure values and color legends.