Format Individual Parts of the View
You can format individual parts of the view, including text elements such as titles, captions, and tooltips. You can also format individual controls, including legends, filters, highlighters, and parameter controls.
Text elements
There are several ways that text elements, such as titles, captions, and tooltips, can appear on your view. You can choose to hide or show titles and captions on your worksheet. You can also add tooltips to Marks.
Show titles and captions
If a title or caption isn't showing, open the Worksheet menu and select Show Title or Show Caption.
For dashboards and stories, there are equivalent options in their respective menus (such as Dashboard> Show Title). There’s also a check box to turn the dashboard or story title on or off, available in the left-hand pane.

- On a worksheet, hover on the title to access the context menu, select the dropdown arrow on the right-hand side, and select Edit Title or Edit Caption. Alternatively:
- Right-click (control-click on Mac) the item you want to change and select Edit.
- In Tableau Cloud, double-click the worksheet title.
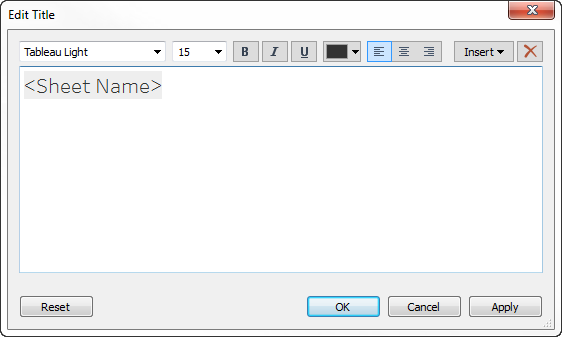
- In the Edit Title dialog box, modify the text and format the font, size, style, color, and alignment. If desired, use the Insert menu to add dynamic text such as sheet properties and field values. To reset a title or caption back to the default, click Reset.
For information on showing or hiding a title, see Titles.
- On a worksheet, right-click (control-click on Mac) the title, caption, or legend and select Format <item>—for example, Format Title.
- In the Format pane, use the drop-down lists to change the default shading or border.

For information on showing or hiding a title, see Titles.
- On a dashboard, double-click the title.
- In the Edit Title dialog box that appears, format the title as you like. You can enter a new title for the dashboard or a description, and change the font type, size, emphasis, color, and alignment. You can also type in a website URL and Tableau will automatically create a hyperlink.
Note: If you edit the hyperlink, make sure to delete the entire hyperlink and then reenter the new one. If you don’t do this, the text of the hyperlink updates, but the URL path won’t.
- When finished, click OK. The dashboard title updates with the changes.
Tooltips are details that appear when you rest the pointer over one or more marks in the view. Tooltips also offer convenient tools to quickly filter or remove a selection, select marks that have the same value or view underlying data.
- For more information on tooltips, see Tooltips.
- To show a visualization in a tooltip, see Create Views in Tooltips (Viz in Tooltip).
You can edit the tooltip to include both static and dynamic text. You can also modify which fields are included in the automatic tooltip.
- On the Marks card select Tooltip. Tooltips are specified for each sheet and can be formatted using the formatting tools along the top of the Edit Tooltip dialog box.
- Use the Insert menu at the top of the dialog box to add dynamic text such as field values, sheet properties, and more.
- Use the formatting tools along the top of the Edit Tooltip dialog box.
There are several optional customizations as well.
Dynamic text values
Use the Insert drop-down list at the top of the dialog box to add dynamic text such as field values, sheet properties, and more.
The All Fields option on the Insert menu adds all field names and values that are used in the view. Inserting the All Fields parameter updates the tooltip as you change the view. You can also use the All Fields option to exclude fields.
Command buttons
Select the Include command buttons option to show filtering and view data options in the tooltip.
For example, including command buttons adds Keep Only, Exclude, and View Data buttons to the tooltip. These command buttons are available both in Tableau Desktop and when the view is published to the web or viewed on a mobile device. Unchecking Include command buttons will also hide the aggregation summary if multiple marks are selected.
Selection by category
Select the Allow selection by category check box to select marks in a view that have the same value by selecting a discrete field in a tooltip. For more information see Tooltips.
Controls
As of Tableau version 2024.2, you can format controls, including legends, quick filters, highlighters, and parameter controls individually or all together. In Tableau versions 2024.1. and earlier, these controls take on whatever formatting is applied at the worksheet level.
Show Controls
Legends
A legend automatically shows on the worksheet when you encode marks by dropping them on the Color, Shape, or Size cards.
Filters
If you aren't seeing a filter control, hover over the field in the filters box, expand the context menu, and select Show Filter.
Highlighters
A highlighter automatically shows on the worksheet when it has been turned on.
To learn more about highlighters, see Highlight Data Points in Context.
Parameters
If you aren't seeing a parameter control, hover over the parameter in the data pane, expand the context menu, and select Show Parameter.
To learn more about parameters, see Create Parameters.
Format Controls on Tableau Desktop
From the control, expand the context menu by clicking the dropdown arrow on the top right of the box.

Select Format…
Select This [Control]... or All [Controls]...

If you select This [Control]..., any formatting updates you make will apply to the selected control only. If you select All [Controls]..., any formatting you update will apply to all of that type of control, such as all parameters.
Make your formatting changes in the formatting pane on the left side of the viz. You can format the Title and Body text, including font, font style, text, and color. You can also format the background shading and border.
Note: On Tableau Desktop, formatting an individual control overrides formatting applied at the worksheet level. If you'd like to make subsequent formatting changes apply to all elements, you must first clear the formatting applied at the individual control level. Some formatting elements, such as borders, may not render on a worksheet, but will show on the viz when added to a dashboard.
Format Controls on Tableau Cloud and Tableau Server
From the control, expand the context menu by clicking the down arrow on the top right of the box.
Select Format.
A formatting pane appears to the right of the viz.

By default, changes are set to apply to the Selected control only. If you'd like to format all of the types of control for this view, such as all filters, select All.
Make your formatting changes. You can format the text, including font, font style, text, and color, and you can format the background shading and border. You can also choose to show or hide the title of the control from this pane.
Note: On Tableau Cloud, you can access individual formatting controls on the worksheet; formatting individual controls isn’t accessible on a dashboard.
For more information about adding controls, including legends, filters, and parameter controls to a worksheet, see Additional Shelves, Legends, Cards, and Controls.