Create Views in Tooltips (Viz in Tooltip)
As you craft views and look for ways to reveal more details about data to your audience, you can embed visualizations within tooltips—also known as "Viz in Tooltip."

When a user hovers over a mark, the tooltip displays relevant data and details from another visualization filtered to that mark.
You can show related vizzes in tooltips to help your audience engage with the data at a different or deeper level, while keeping them in the current context and maximizing the space available for the current view.
Watch a video: For advanced tips, watch Next Level Viz in Tooltip(Link opens in a new window), a 55-minute free video presentation.
For information on how to edit regular tooltips, see Format tooltips .
Create a visualization in the source worksheet in Tableau.
Create a visualization in a target worksheet view to serve as the Viz in Tooltip. Give the worksheet a name that helps you identify it as a Viz in Tooltip.
In the source worksheet, click Tooltip in the Marks card. In the Tooltip Editor, insert a reference to the Viz in Tooltip target worksheet. For details, see Configure a Viz in Tooltip.
Optional: Hide the target sheet for the Viz in Tooltip. For details, see Create Views in Tooltips (Viz in Tooltip).
Test the resulting Viz in Tooltip by hovering over different marks in the source worksheet view. If the Viz in Tooltip is too large for the tooltip window, adjust the height and width of the target worksheet visualization. You might also consider simplifying the structure and detail in the target visualization. For details, see Change the size of the Viz in Tooltip.
Notes:
By default, Viz in Tooltip is filtered on All Fields. Change the level of detail for Viz in Tooltip by defining a filter on Selected Fields. For details, see Change the filter for the Viz in Tooltip.
In Tableau version 2023.3 and later, Viz in Tooltip is not available for totals and grand totals.
Notes: By default, Viz in Tooltip is filtered on All Fields. Change the level of detail for Viz in Tooltip by defining a filter on Selected Fields. For details, see Change the filter for the Viz in Tooltip.
In Tableau version 2023.3 and later, Viz in Tooltip is not available for totals and grand totals.
You will need a source worksheet visualization and a target worksheet visualization to create a Viz in Tooltip.
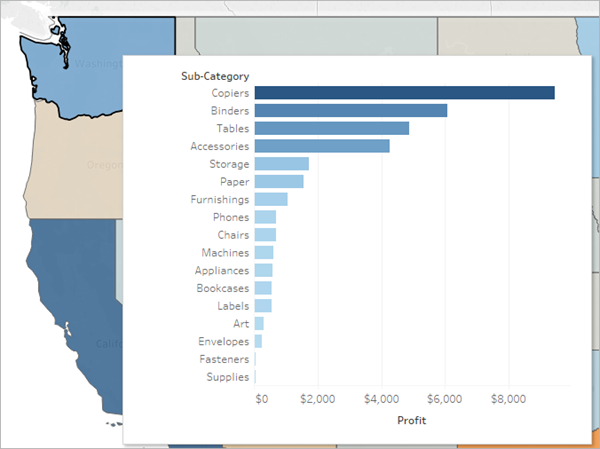
These steps use the example of a source view that is a map showing sales profits by state, and a target sheet with a chart that shows profits by product sub-category.
Create the source and target visualizations in a worksheet
In Tableau, figure out the worksheet that you want to use as your source visualization. Or build a new visualization on a new worksheet. This will be your source view.
Create a new worksheet to serve as the target visualization.
Keep the number of filters used in the target view to a minimum.
Name the target view so that you will be able to identify it in a list of other sheets.
Insert a reference to the target worksheet in the source worksheet tooltip
In the source sheet, click the Tooltip button in the Marks card to open the Tooltip Editor.
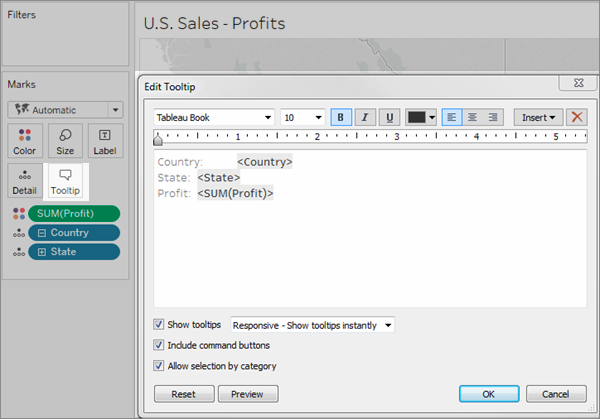
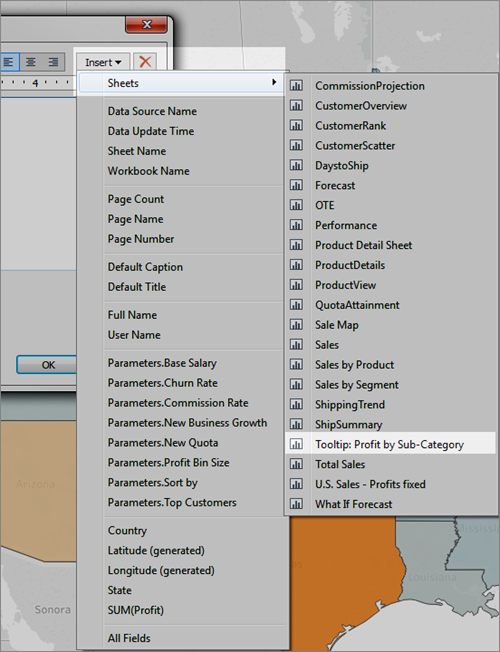
Click the Insert menu in the Tooltip Editor. In the Insert menu, select Sheets, and then select a target sheet.
For example:
The markup for the Viz in Tooltip is automatically added. (In this example, the original markup fields have been removed.)
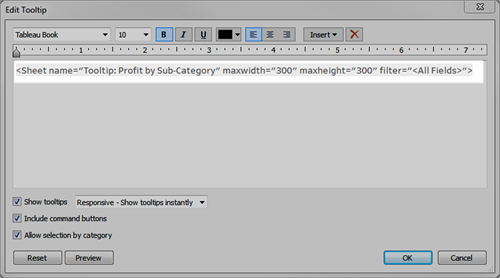
Example of markup automatically generated for Viz in Tooltip
This is the resulting markup for this example:
<Sheet name="Tooltip: Profit by Sub-Category" maxwidth="300" maxheight="300" filter="<All Fields>">By default, the Viz in Tooltip is filtered on All Fields (filtered on all fields possible, and on the most specific level of detail).
Click OK.
Go back to the source sheet and test the Viz in Tooltip. Hover over different marks to see the resulting Viz in Tooltip. Make adjustments to the target view as necessary to improve the Viz in Tooltip.
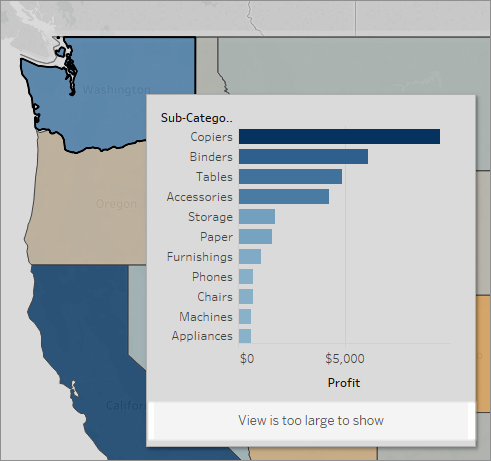
The Viz in Tooltip in this example shows a message that indicates that some of the data in the target view is not being shown. If you see this message, you can adjust the height and width settings in the parameters for the Viz in Tooltip to make the view size larger.
You can manually change the maxwidth and maxheight values to resize the Viz in Tooltip. The default size is 300 by 300 pixels. To change the size, manually replace "300" with another value. If you need to set the value greater than 600 pixels, you might want to reconsider whether the target view is a good candidate for Viz in Tooltip.
In the source sheet, click the Tooltip button in the Marks card to open the Tooltip Editor.
Select the number value for
maxwidthandmaxheightand type a different value to replace it. For example:<Sheet name="Tooltip: Profit by Sub-Category" maxwidth="500" maxheight="500" filter="<All Fields>">Click OK
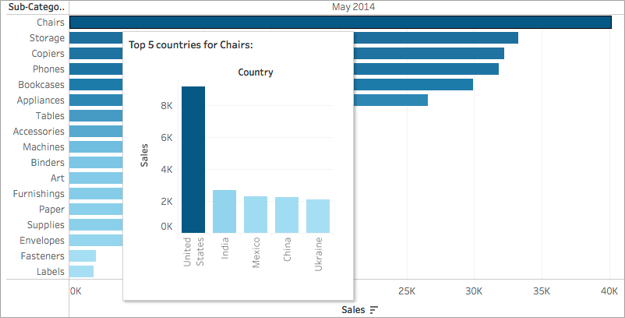
Example of a Viz in Tooltip set to 500 pixels width and height. The author also created more space for the header text in the in the target sheet view.
By default, Viz in Tooltip is filtered on All Fields. This means the view is filtered on all dimensions in the current view (not including fields on the Filters shelf), at the most specific level of detail.
You can change the level of detail for Viz in Tooltip by defining a filter on selected fields, similar to filtering on Selected Fields in Filter Actions.
In the source sheet, click the Tooltip button in the Marks card to open the Tooltip Editor.
Place your cursor within the filter value (
filter="<place cursor here>"), and then click the Insert menu to select an available field. Or, manually replace the <All Fields> value with the name of a field in the view. For example:<Sheet name="Tooltip: Profit by Sub-Category" maxwidth="300" maxheight="500" filter="<State>">You can also filter more than one selected field by separating the field names with a comma. For example:
<Sheet name="Tooltip: Profit by Sub-Category" maxwidth="300" maxheight="500" filter="<Country>,<State>">To filter on date level, you will need to include the string that specifies the date level with the field name. For example:
<Sheet name="Tooltip: Profit by Month" maxwidth="300" maxheight="300" filter="<MONTH(Order Date)>">Note: The date filter in the Viz in Tooltip script must match exactly the date level of the field in the view.
You can hide and show a worksheet used for Viz in Tooltip with options similar to those for dashboards and stories.
Hide a Viz in Tooltip worksheet
Note: If the source sheet is hidden for a dashboard, you will first need to first unhide that worksheet from its dashboard to access it. For details, see Manage Sheets in Dashboards and Stories.
To hide a Viz in Tooltip worksheet, from the tab for the target worksheet that is the Viz in Tooltip, select Hide.
To show a Viz in Tooltip worksheet, from the tab for the source worksheet, select Unhide All Sheets.
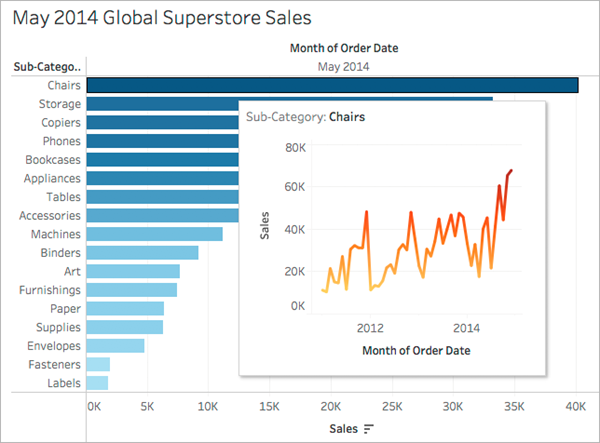
When you create a Viz in Tooltip, users can hover over a mark to examine details-on-demand, within the context of the original view. A Viz in Tooltip is a static image of data from another view that is relevant to a mark in the current view. Hovering over or selecting the mark reveals data from another sheet—filtered for that mark—in its tooltip.
Watch a video: To see more examples and related concepts, see Next Level Viz in Tooltip(Link opens in a new window), a 55-minute free video presentation.
Use Viz in Tooltip to show:
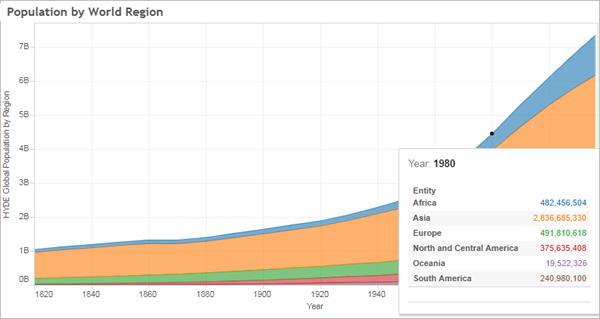
Data at another level of detail
Different, but relevant data
How the value of a mark changes over time
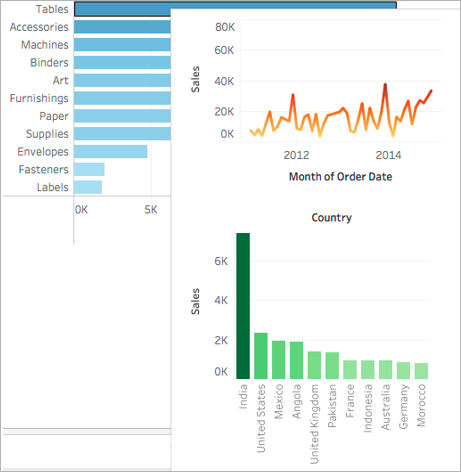
Multiple visualizations in one tooltip
A legend for the main view
When you show related views in tooltips, you can help your audience engage with the data at a deeper level, while maximizing the space available for the current view.
You can use worksheets to create a Viz in Tooltip, but you cannot use dashboards or stories to create a Viz in Tooltip.
A Viz in Tooltip is a static image of a target view, not an interactive sheet. A Viz in Tooltip cannot have its own Viz in Tooltip.
You will need a source worksheet visualization and a target worksheet visualization to create a Viz in Tooltip. You will need to create a target view to make it available in the Tooltip Editor.
Use a standard naming scheme for the target sheets you plan to show in tooltips, such as Tooltip: Name of View. Using a standard naming scheme will help you keep track of views that you are using in tooltips.
For the target view, consider the size of the view data and how the view will look in the tooltip. You will be able to specify the size for the Viz in Tooltip when you configure it, but you will need to check to see how it is displaying and possibly make adjustments to the view before you publish it.
Remember that the target view is displayed in the context of the source view. Keeping the target visualization simple can help with performance and reduce cognitive load.
If you click Show Me in the source sheet and it changes the view structure, all tooltip edits including Viz in Tooltip references will be reset. You will need to reconfigure the Viz in Tooltip.
One target sheet can be referenced by one Viz in Tooltip source sheet at a time, because filters are applied directly to the referenced sheet. When a sheet is already being used as a target sheet in a tooltip, it becomes unavailable for selection in the Tooltip Editor.
By default, Viz in Tooltip is filtered on All Fields, which considers all fields in the view (at the most specific level of detail) when identifying matching records. You can change the level of detail for Viz in Tooltip by defining a filter on Selected Fields, similar to filtering on Selected Fields in Filter Actions. For related details, see Create Advanced Highlight Actions.
Filtering on Selected Fields does not work across different data sources. If the source and target views are using different data sources, filtering on All Fields will automatically detect the fields in common (if they share the same alias), and filter on them. Filtering on Selected Fields, however, will not work.